
Capital and Shares
Capitalization
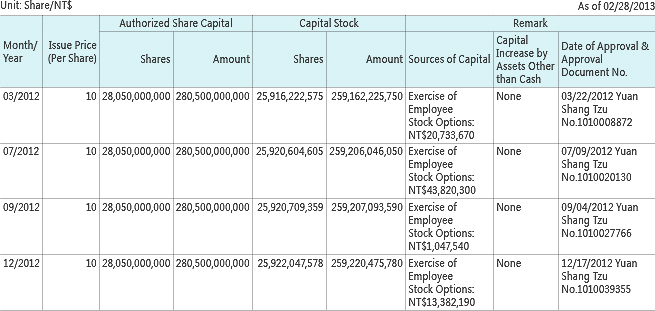
Capital and Shares
Unit: Share As of 02/28/2013
| Type of Stock | Authorized Share Capital | Total | |||
|---|---|---|---|---|---|
| Issued Shares | Unissued Shares |
||||
| Listed | Non-listed | Total | |||
| Common Stock | 25,926,367,175 | 0 | 25,926,367,175 | 2,123,632,825 | 28,050,000,000 |
Shelf Registration: None.
Composition of Shareholders

Distribution Profile of Share Ownership
Common Share As of 07/10/2012 (last record date)
| Shareholder Ownership (Unit: Share) |
Number of Shareholders |
Ownership | Ownership (%) |
|---|---|---|---|
| 1 ~ 999 | 179,839 | 40,386,381 | 0.16% |
| 1,000 ~ 5,000 | 146,222 | 322,008,654 | 1.24% |
| 5,001 ~ 10,000 | 32,754 | 231,441,009 | 0.89% |
| 10,001 ~ 15,000 | 13,134 | 158,402,696 | 0.61% |
| 15,001 ~ 20,000 | 5,653 | 98,500,500 | 0.38% |
| 20,001 ~ 30,000 | 6,415 | 154,591,336 | 0.60% |
| 30,001 ~ 40,000 | 2,944 | 101,246,006 | 0.39% |
| 40,001 ~ 50,000 | 1,813 | 81,277,324 | 0.31% |
| 50,001 ~ 100,000 | 3,518 | 243,418,575 | 0.94% |
| 100,001 ~ 200,000 | 1,863 | 256,673,695 | 0.99% |
| 200,001 ~ 400,000 | 1,173 | 330,352,824 | 1.27% |
| 400,001 ~ 600,000 | 479 | 233,532,296 | 0.90% |
| 600,001 ~ 800,000 | 268 | 185,504,687 | 0.72% |
| 800,001 ~ 1,000,000 | 203 | 181,682,616 | 0.70% |
| Over 1,000,001 | 1,398 | 23,301,690,760 | 89.90% |
| Total | 397,676 | 25,920,709,359 | 100.00% |
Preferred Share: None.
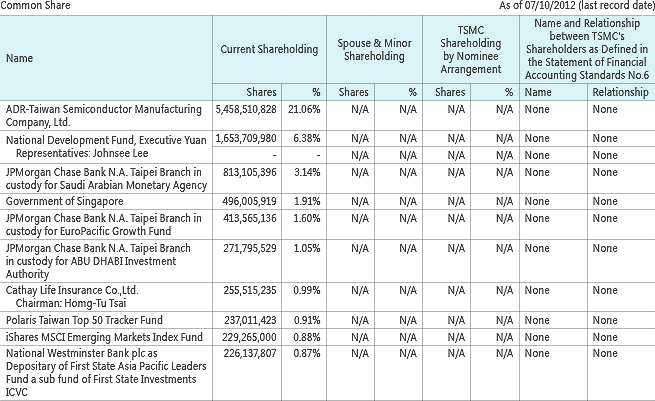
Major Shareholders
Common Share As of 07/10/2012 (last record date)
| Shareholders | Total Shares Owned | Ownership (%) |
|---|---|---|
| ADR-Taiwan Semiconductor Manufacturing Company, Ltd. | 5,458,510,828 | 21.06% |
| National Development Fund, Executive Yuan | 1,653,709,980 | 6.38% |
| JPMorgan Chase Bank N.A. Taipei Branch in custody for Saudi Arabian Monetary Agency | 813,105,396 | 3.14% |
| Government of Singapore | 496,005,919 | 1.91% |
| JPMorgan Chase Bank N.A. Taipei Branch in custody for EuroPacific Growth Fund | 413,565,136 | 1.60% |
| JPMorgan Chase Bank N.A. Taipei Branch in custody for ABU DHABI Investment Authority | 271,795,529 | 1.05% |
| Cathay Life Insurance Co.,Ltd. | 255,515,235 | 0.99% |
| Polaris Taiwan Top 50 Tracker Fund | 237,011,423 | 0.91% |
| iShares MSCI Emerging Markets Index Fund | 229,265,000 | 0.88% |
| National Westminster Bank plc as Depositary of First State Asia Pacific Leaders Fund a sub fund of First State Investments ICVC | 226,137,807 | 0.87% |
Net Change in Shareholding and Net Change in Shares Pledged by Directors, Management and Shareholders with 10% Shareholdings or More
Unit: Share
|
Title Name |
2012 | 01/01/2013 ~ 02/28/2013 | ||
|---|---|---|---|---|
| Net Change in Shareholding |
Net Change in Shares Pledged (Note 1) |
Net Change in Shareholding |
Net Change in Shares Pledged (Note 1) |
|
|
Vice Chairman F.C. Tseng |
- |
- | - | - |
|
Chairman & CEO Morris Chang |
- | - | - | - |
| Director National Development Fund, Executive Yuan |
- | - | - | - |
| Representative: Johnsee Lee |
- | - | - | - |
|
Director Rick Tsai |
(1,124,000) | - | (170,000) | - |
|
Independent Director Sir Peter Leahy Bonfield |
- | - | - | - |
|
Independent Director Stan Shih |
- | - | - | - |
|
Independent Director Thomas J. Engibous |
- | - | - | - |
|
Independent Director Gregory C. Chow |
- | - | - | - |
|
Independent Director Kok-Choo Chen |
- | - | - | - |
|
Executive Vice President & Co-Chief Operating Officer Shang-yi Chiang (Note 2) |
(1,080,000) | - | (50,000) | - |
|
Executive Vice President & Co-Chief Operating Officer Mark Liu (Note 2) |
(385,000) | - | (35,000) | - |
|
Executive Vice President & Co-Chief Operating Officer C.C. Wei (Note 2) |
- | - | - | - |
|
Senior Vice President & Chief Information Officer Information Technology & Materials Management and Risk Management Stephen T. Tso |
(350,000) | - | (130,000) | - |
|
Senior Vice President & General Counsel Legal Richard Thurston |
(720,000) | - | - | - |
|
Senior Vice President, Chief Financial Officer &
Spokesperson Finance Lora Ho |
- | - | - | - |
|
Senior Vice President Worldwide Sales and Marketing Jason C.S. Chen |
(270,000) | - | (50,000) | - |
|
Vice President Operations/Affiliate Fabs M.C. Tzeng |
- | - | (26,000) | - |
|
Vice President Research and Development Wei-Jen Lo |
(357,000) | - | (76,000) | - |
|
Vice President & Chief Technology Officer Research and Development Jack Sun |
(224,000) | - | - | - |
|
Vice President Operations/Product Development Y.P. Chin |
(265,000) | - | (80,000) | - |
|
Vice President Quality and Reliability N.S. Tsai |
- | - | (24,000) | - |
|
Vice President &
President of TSMC North America Rick Cassidy |
324,900 | - | - | - |
|
Vice President Human Resources L.C. Tu (Note 3) |
- | - | - | - |
|
Vice President Operations/Mainstream Fabs and Manufacturing Technology J.K. Lin |
(300,000) | - | (89,000) | - |
|
Vice President Operations/300mm Fabs J.K. Wang |
(5,000) | - | (24,000) | - |
|
Vice President Corporate Planning Organization Irene Sun |
565,578 | - | - | - |
|
Vice President Research and Development Burn J. Lin |
- | - | - | - |
|
Vice President Research and Development Y.J. Mii |
- | - | - | - |
|
Vice President Research and Development Cliff Hou |
- | - | - | - |
This refers to the creation of security interest over TSMC shares in favor of creditors, usually in connection with a shareholder’s own financing activities.
On March 2, 2012, Senior Vice President of R&D Dr. Shang-yi Chiang, Senior Vice President of Operations Dr. Mark Liu, and Senior Vice President of Business Development Dr. C.C. Wei were appointed as Executive Vice Presidents and Co-Chief Operating Officers, effective March 5, 2012.
On March 5, 2013, Vice President of Human Resources Mr. L.C. Tu was appointed as the President of TSMC China, effective March 15, 2013.
Stock Trade with Related Party: None.
Stock Pledge with Related Party: None.
Related Party Relationship among Our 10 Largest Shareholders
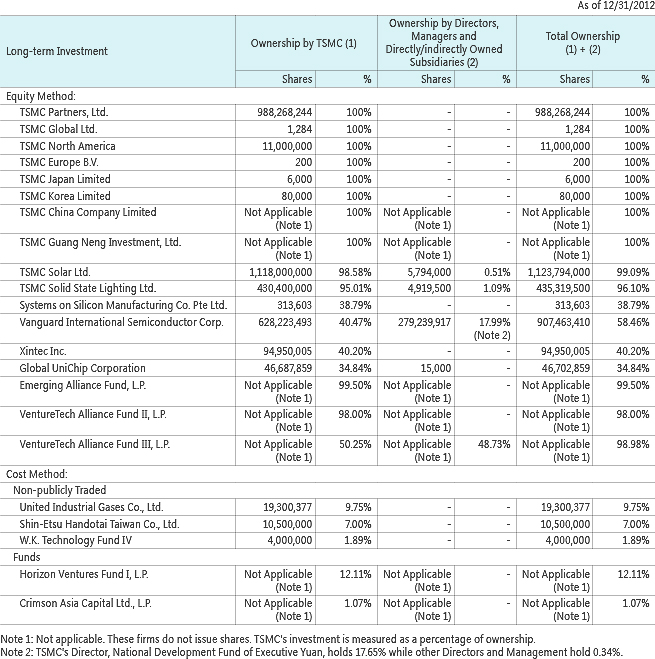
Long-term Investment Ownership
Share Information
TSMC’s earnings per share increased 23.8% in 2012 to NT$6.41 per share. The following table details TSMC’s net worth, earnings, dividends and market price per common share in 2012, as well as other data regarding return on investment.
Net Worth, Earnings, Dividends, and Market Price Per Common Share
| Item | 2011 | 2012 | 01/01/2013 ~ 02/28/2013 |
|---|---|---|---|
| Market Price Per Share (Note 1) | |||
| Highest Market Price | 78.00 | 99.20 | 109.00 |
| Lowest Market Price | 63.30 | 74.30 | 99.00 |
| Average Market Price | 72.09 | 84.08 | 102.27 |
| Net Worth Per Share | |||
| Before Distribution | 24.29 | 27.90 | - |
| After Distribution | 21.29 | (Note 5) | - |
| Earnings Per Share | |||
| Weighted Average Shares (thousand shares) | 25,924,682 | 25,927,936 | - |
| Diluted Earnings Per Share | 5.18 | 6.41 (Note 5) |
- |
| Dividends Per Share | |||
| Cash Dividends | 3.00 | 3.00 (Note 5) |
- |
| Accumulated Undistributed Dividend | - | - | - |
| Return on Investment | |||
| Price/Earnings Ratio (Note 2) | 13.92 | (Note 5) | - |
| Price/Dividend Ratio (Note 3) | 24.03 | (Note 5) | - |
| Cash Dividend Yield (Note 4) | 4% | (Note 5) | - |
Note 1: Referred to TWSE website
Note 2: Price/Earnings Ratio = Average Market Price/Diluted Earnings Per Share
Note 3: Price/Dividend Ratio = Average Market Price/Cash Dividends Per Share
Note 4: Cash Dividend Yield = Cash Dividends Per Share/Average Market Price
Note 5: Pending shareholders' approval
Dividend Policy
TSMC’s profits may be distributed by way of cash dividend and/or stock dividend. The preferred method of distributing profits is by way of an annual cash dividend. Under TSMC’s Articles of Incorporation, stock dividends shall not exceed 50% of the total dividend distribution in any given fiscal year. TSMC does not pay dividends when there is no profit or retained earnings.
Distribution of Profit
The Board adopted a proposal for 2012 profit distribution at its Meeting on February 5, 2013. The proposal will be effected according to the relevant regulations, upon the approval of shareholders at the Annual Shareholders’ Meeting on June 11, 2013.
In addition, according to the Company’s Articles of Incorporation, TSMC shall allocate no more than 0.3% of earnings available for distribution (net income after a regulatory required deduction for prior years’ losses and contributions to legal and special reserves) as compensation to directors, and not less than 1% as a bonus to employees. Profit sharing to employees, to be distributed after the 2013 Annual Shareholders’ Meeting, was recorded as a charge to earnings of proximately 6.7% of net income in year 2012; compensation to directors were expensed based on estimated amount of payment. The proposal will be effected according to the relevant regulations, upon the approval of shareholders at the Annual Shareholders’ Meeting on June 11, 2013. If the actual amounts subsequently resolved by the shareholders differ from the above estimated amounts, the differences will be recorded in the year of shareholders’ resolution as a change in accounting estimate.
Proposal to Distribute 2012 Profits
Unit: NT$
| Cash Dividends to Common Shareholders (NT$3.0 per share) | 77,773,307,004 |
|---|
Employees' cash bonus and profit sharing and compensation to directors for the year 2012 which have been expensed under the Company's income statements are listed below:
-NT$11,115,239,773 distributed employees' cash bonus
-NT$11,115,239,772 employees' cash profit sharing to be distributed after 2013 Annual Shareholders' Meeting
-NT$71,351,700 directors' compensation
2011 Directors’ Compensation and Employee Profit Sharing
| Board Resolution (02/14/2012) | Actual Result (Note) | |
|---|---|---|
| Amount (NT$) | Amount (NT$) | |
| Directors' Compensation (Cash) | 62,323,764 | 62,323,764 |
| Employee's Cash Profit Sharing | 8,990,026,475 | 8,990,026,475 |
| Total | 9,052,350,239 | 9,052,350,239 |
Note: Each of the above two items, being approved by the Board, has been expensed at the same amount under the
Company's 2011 income statements.