
Page 98 - 2017 TSMC Annual Report
P. 98
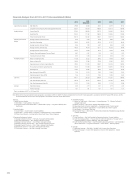
Financial Analysis from 2013 to 2017 (Unconsolidated) (Note)
2013 2014 (Adjusted)
2015
2016
2017 Debt Ratio (%)
29 88
26 48
23 63
24 39
Long-term Fund to Property Plant and Equipment Ratio (%)
132 57
156 24 168 96
156 13 Current Ratio (%)
137 62
208 09
219 72
144 00
Quick Ratio (%)
118 35
171 82
186 00
128 65
Times Times Interest Earned (Times)
104 10 10 120 82
144 41
146 73
Average Collection Turnover (Times)
9 26 8 29 8 8 58
8 8 89
Days Sales Outstanding
39
40
44 02
42 54
41
07
Average Inventory Turnover (Times)
9 06
7 90
6 87
8 56 Average Inventory Turnover Days 40
30
46 18 53 11 42 63
Average Payment Turnover (Times)
18 55
18 64
19 73
19 04 Property Plant and Equipment Turnover (Times)
0 87
0 97
1 03
1 03
Total Assets Turnover (Times)
Return on Total Assets (%)
0 55
0 58
0 55
0 54
17 58
20 22
20 42 19 58
Return on Equity (%)
24 00
27 86 27 04 25 60
Operating Income to Paid-in Capital Ratio (%)
78 93
112 09
120 87
142 59
Pre-tax Income to Paid-in Capital Ratio (%)
83 20 116 08 134 97
148 55
Net Margin (%)
31 83 34 85
36 63
35
70
Basic Earnings Per Share (NT$)
7 26 10 18 11 82
12 89
Diluted Earnings Per Share (NT$)
7 26 10 18 11 82
12 89
Cash Flow Ratio (%)
179 11 230 29 264 94
172 81
Cash Flow Adequacy Ratio (%)
86 78 90
72
102 35
107 06
Cash Flow Reinvestment Ratio (%)
12 32 13 30
13 85
11 74
Operating Leverage
2 46 2 19 2 31 2 19 Financial Leverage
1 1 01 1 1 01 1 1 01 1 1 01 Capital Structure Analysis Liquidity Analysis Operating Performance Analysis Pro tability Analysis Cash Flow Leverage
There’s no deviation of 2017 vs 2016
over 20% 21 52 160 48
141 63
118 68 144 04 7 86 46 44 8 39
43 49 16
39
0 97
0 51 18 29 23 57
144 50 151 68 35
40
13 23 13 23 184 45 99 42 10 98 2 2 2 22
1 1 01 096
Note: Before 2012 2012 nancial nancial nancial statements statements statements were were were prepared prepared prepared in in in accordance accordance accordance with with with R R R O C GAAP The nancial nancial nancial statements statements statements for for for 2012-2013 were were were prepared prepared prepared in in in accordance accordance accordance with with with 2010 Taiwan-IFRSs Taiwan-IFRSs version version and the nancial nancial nancial statements statements statements for for 2014-2017 were were prepared prepared in in accordance accordance with with 2013 Taiwan-IFRSs version *Glossary
1 1 Capital Structure Analysis (1) Debt Ratio Ratio = = Total Total Liabilities / Total Total Assets Assets (2) Long-term Long-term Fund to Fixed Fixed Assets Assets Assets Ratio Ratio = = (Shareholders’ Equity + Long-term Long-term Liabilities) / / Net Fixed Assets 2 Liquidity Analysis (1) Current Current Current Current Ratio Ratio = = Current Current Current Current Assets Assets / Current Current Current Current Liabilities (2) Quick Ratio Ratio = = = (Current Assets Assets - - Inventories - - Prepaid Expenses) / / / Current Current Current Current Current Liabilities Liabilities (3) Times Interest Interest Interest Earned = = Earnings before Interest Interest Interest and Taxes / / Interest Interest Interest Expenses Expenses 3 Operating Performance Analysis (1) Average Average Average Collection Collection Turnover Turnover = = Net Sales Sales / / Average Average Average Trade Receivables (2) Days Sales Sales Sales Outstanding
= = = 365 / / / Average Average Average Average Average Collection Collection Turnover Turnover Turnover (3) Average Average Average Average Average Inventory Inventory Inventory Inventory Turnover Turnover Turnover Turnover = = = Cost of Sales Sales / / / Average Average Average Average Average Inventory Inventory Inventory Inventory (4) Average Average Average Average Average Average Inventory Inventory Inventory Inventory Turnover Turnover Turnover Turnover Days = = = 365 / / / Average Average Average Average Average Average Inventory Inventory Inventory Inventory Turnover Turnover Turnover Turnover (5) Average Average Average Average Average Payment Turnover Turnover Turnover Turnover = = = Cost of Sales Sales / / / Average Average Average Average Average Trade Payables (6) Fixed Fixed Assets Assets Assets Assets Turnover Turnover Turnover = = = Net Net Net Sales Sales Sales / / / Average Average Average Average Net Net Net Fixed Fixed Assets Assets Assets Assets (7) Total Total Assets Assets Assets Assets Turnover Turnover = = Net Net Net Sales Sales / / Average Average Total Total Assets Assets Assets Assets 4 5
6 Pro tability Analysis (1) Return on Total Total Assets Assets = (Net Income + Interest Expenses * (1 (1 - Effective Tax Rate)) / Average Total Total Assets Assets (2) Return on Equity Equity = = Net Income Income Income / Average Average Shareholders’ Equity Equity (3) Operating Operating Income Income Income Income Income to to Paid-in Paid-in Paid-in Paid-in Capital Capital Capital Capital Ratio Ratio = = = Operating Operating Income Income Income Income Income / / / Paid-in Paid-in Paid-in Paid-in Capital Capital Capital Capital (4) Pre-tax Income Income Income Income Income to to Paid-in Paid-in Paid-in Paid-in Capital Capital Capital Capital Ratio Ratio = = = Income Income Income Income Income before Tax / / / Paid-in Paid-in Paid-in Paid-in Capital Capital Capital Capital (5) Net Net Net Net Margin = = Net Net Net Net Income Income Income / Net Net Net Net Sales (6) Earnings Per Share Share = = (Net Income Income - Preferred Stock Dividend) / / Weighted Average Number
of Shares Outstanding
Cash Cash Flow Flow (1) Cash Cash Cash Cash Cash Flow Flow Flow Ratio Ratio = = Net Cash Cash Cash Cash Cash Provided by Operating Activities / / Current Liabilities (2) Cash Cash Cash Cash Cash Flow Flow Adequacy Ratio Ratio = = Five-year Five-year Sum Sum of of Cash Cash Cash Cash Cash from Operations / / Five-year Five-year Sum Sum of of Capital Expenditures Inventory Additions and Cash Cash Cash Cash Cash Dividend (3) Cash Cash Cash Cash Flow Reinvestment Ratio = (Cash Provided by Operating Activities - - Cash Cash Cash Cash Dividends) / (Gross Fixed Assets Assets + + + Long-term Investments + + + Other Assets Assets + + + Working Capital)
Leverage
(1) Operating Leverage
Leverage
Leverage
= = (Net Sales - - Variable Cost) / / Income Income Income from from from Operations Operations Operations (2) Financial Leverage
Leverage
= = Income Income Income from from from Operations Operations Operations / / (Income from from from Operations Operations Operations - - Interest Expenses) 