
Page 96 - 2017 TSMC Annual Report
P. 96
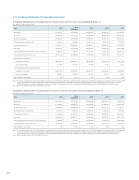
6 1 2 Condensed Statement of Comprehensive Income
Condensed Statement of Comprehensive Income
from 2013 to 2017 (Consolidated) (Note 1)
Unit: NT$ NT$ thousands (Except EPS: NT$)
Net Revenue
Gross Pro t Income
from Operations
Non-operating Income
and Expenses
Income
Income
before Income
Income
Tax
Net Income
Other Comprehensive Income
Income
for the the Year Net of Income
Income
Tax
Total Comprehensive Income
for the Year Net Income
(Loss) Attributable to:
Shareholders of the Parent
Noncontrolling Interests
Total Comprehensive Income
(Loss) Attributable to:
Shareholders of the Parent
Noncontrolling Interests
Basic Earnings Per Share (Note 2)
977 447 241 494 826 402 385 559 223
10 573 807 396 133 030 343 146 848 (28 821 631) 314 325 217
343 111 476 35 372
314 294 993 30 224 13 23
Item
2013 2014 (Adjusted)
2015
2016
2017 597 024 197
762 806 465
843 497 368
947 938 344
280 945 507
377 722 016
410 394 893
474 832 098
209 429 363
295 870 309
320 047 775
377 957 778
6 057 759
6 208 048
30 381 136
8 001 602
215 487 122
302 078 357
350 428 911
385 959 380
188 018 937
263 763 958
306 556 167
334 338 236
16
352 248
11 805 021
(14 714 182)
(11 067 189)
204 371 185
275 568 979
291 841 985
323 271 047 188 146 790
263 881 771
306 573 837
334 247 180
(127 853)
(117 813)
(17 670)
91
056
204 505 782
275 670 991
291 867 757
323 186 736
(134 597)
(102 012)
(25 772)
84 311 7 26 10 18 11 82 12
89
Note 1: The The nancial nancial nancial statements statements statements for for 2013 2013 were were were prepared prepared in in in in accordance accordance with with 2010 Taiwan-IFRSs Taiwan-IFRSs version version and and the nancial nancial nancial statements statements statements for for 2014-2017 were were were prepared prepared in in in in accordance accordance with with 2013 2013 Taiwan-IFRSs Taiwan-IFRSs version version The The nancial nancial nancial statements statements statements of of of of of 2014 2014 were were were adjusted to to retrospectively apply newly effected GAAP Adjustments included a a a a a a a a a a a a a a a a a a a a a a a a a a a a a a a a a a a a a a decrease decrease decrease decrease of of of of of NT$12 359 thousand thousand thousand thousand in in in in in in in in in in gross pro t t t t t t t t t t t t t t t t t t t t t t t t t t t t t a a a a a a a a a a a a a a a a a a a a a a a a a a a a a a a a a a a a a a decrease decrease decrease decrease of of of of of NT$19 984 thousand thousand thousand thousand in in in in in in in in in in income income income from operations a a a a a a a a a a a a a a a a a a a a a a a a a a a a decrease decrease decrease decrease of of of of NT$16 911
thousand thousand thousand thousand in in in in in in in in in in net income income income and and and and and and a a a a a a a a a a a a a a a a a a a a a a a a a a a a decrease decrease decrease decrease of of of of NT$46 054 thousand thousand thousand thousand in in in in in in in in in in total comprehensive income income income for the year year Note 2: Based on on weighted average shares outstanding in in in in each year Condensed Statement of Comprehensive Income
from 2013 to 2017 (Unconsolidated) (Note 1)
Unit: NT$ NT$ thousands (Except EPS: NT$)
Net Revenue
Gross Pro t Income
from Operations
Non-operating Income
and Expenses
Income
Income
before Income
Income
Tax
Net Income
Other Comprehensive Income
Income
for the the Year Net of Income
Income
Tax
Total Comprehensive Income
for the Year Basic Earnings Per Share (Note 2)
Item
2013 2014 (Adjusted)
2015
2016
2017 591 087 600
757
152 389
837
046 888
936 387 291 271 644 860
366 899 120
397 708 840
461 808 296
204 653 892
290 640 302 313 408 698
369 730 533
11 062 658
10 363
515
36 579 970
215 716 550
301 003 817
349 988 668
15 458 427
385 188 960
188 146 790
263 881 771
306 573 837
334 247 180
16
358 992
11 789 220
(14 706 080)
(11 060 444)
204 505 782
275 670 991
291 867 757
323 186 736
7 26 10 18 11 82 12
89
969 136
109 478 937
691 374 690 117 18 626 059 393 316 176 343 111 476 (28 816 483) 314 294 993 13 23
094
Note 1: The The nancial nancial nancial statements statements statements for for 2013 2013 were were were prepared prepared in in in in accordance accordance with with 2010 Taiwan-IFRSs Taiwan-IFRSs version version and and the nancial nancial nancial statements statements statements for for 2014-2017 were were were prepared prepared in in in in accordance accordance with with 2013 2013 Taiwan-IFRSs Taiwan-IFRSs version version The The nancial nancial nancial statements statements statements of of of of of 2014 2014 were were were adjusted to to retrospectively apply newly effected GAAP Adjustments included a a a a a a a a a a a a a a a a a a a a a a a a a a a a a a a a a a a a a a decrease decrease decrease decrease of of of of of NT$12 583 thousand thousand thousand thousand in in in in in in in in in in gross pro t t t t t t t t t t t t t t t t t t t t t t t t t t t t t a a a a a a a a a a a a a a a a a a a a a a a a a a a a a a a a a a a a a a decrease decrease decrease decrease of of of of of NT$19 356 thousand thousand thousand thousand in in in in in in in in income income income from operations a a a a a a a a a a a a a a a a a a a a a decrease decrease decrease decrease of of of of NT$17 023 thousand thousand thousand thousand in in in in in in in in net income income income and and and and and a a a a a a a a a a a a a a a a a a a a a decrease decrease decrease decrease of of of of NT$46 150 thousand thousand thousand thousand in in in in in in in in total comprehensive income income income for the year Note 2: Based on weighted average shares outstanding in in each year 