
Page 97 - 2017 TSMC Annual Report
P. 97
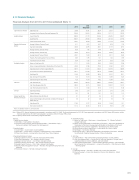
6 1 3 Financial Analysis
Financial Analysis
from 2013 to 2017 (Consolidated) (Note 1)
Capital Structure Analysis
Liquidity Analysis
23
55 153 70 238 97 217
94 119 95
2013 2014 (Adjusted)
2015
2016
2017 Debts Ratio (%)
32 88
30 01 26 24 26 31 Long-term Fund to Property Plant and Equipment (%)
135 40 158 16
169 34 157 17 Current Ratio (%)
188 90
311 70 351 86
256 95
Quick Ratio (%)
168 57 278 03 319 58 241 34 Times Times Interest Earned (Times)
82 41 94 34 110 84 117 74
Average Collection Turnover (Times)
9 11 8 12
8 37 8 8 78 Days Sales Outstanding
40 06
44 95
43 61
41 57 Average Inventory Turnover (Times)
8 39 7 42
6 49 8 8 18 Average Inventory Turnover Days 43 49 49 19 56 24 44 62
Average Payment Turnover (Times)
20 01 19 39 20 10 20 11 Property Plant and Equipment Turnover (Times)
0 85 0 95
1 1 01 1 02 Total Assets Turnover (Times)
0 54
0 55 0 54
0 53 Return on Total Assets (%)
17 11 19 33 19 62
19 03 Return on Equity attributable to Shareholders of the Parent
(%)
24 00
27 86
27 04
25 60
Operating Income
to Paid-in Capital Ratio (%)
80 77 114 10 123 43 145 76 Pre-tax Income
to Paid-in Capital Ratio (%)
83 11 116 50
135 14 148 84 Net Margin (%)
31 49 34 58 36 34 35 27 Basic Earnings Per Share (NT$)
7 26 10 18 11 82 12
89
Diluted Earnings Per Share (NT$)
7 26 10 18 11 82 12
89
Cash Flow Ratio (%)
183 05
209 70 249 67
169 63 Cash Flow Adequacy Ratio (%)
88
35 92 15 103 82 108 57 Cash Flow Reinvestment Ratio (%)
12
16
13 04
13 76 11 51 Operating Leverage
2 40 2 15 2 2 26 2 15 Financial Leverage
1 1 01 1 1 01 1 1 01 1 1 01 Billing Utilization Rate (%)
(Note 3)
91
97 93 92 Advanced Technologies (28-nanometer and below) Percentage of Wafer Sales (%)
30 42
48 54
Sales Growth (%)
17 82 27 77 10 58 12
38 Net Income
Growth (%)
13 12
40 25 16
18 9 03 Pro tability Analysis
Cash Flow 7 7 74
7 88
46 32 16
82 0 95
0 0 50
17 84 23
57 148 69 152 77 35 11 13 23
13 23
163 17 112 41 11 08 Operating Performance
Analysis
47 16
Leverage
Leverage
2 2 2 2 2 2 16
1 1 01 Industry Speci c c Key 91
91
Performance
Indicator
There’s no deviation of 2017 vs 2016
over 20% 58 3 11 2 65
Note 1: Before 2012 2012 nancial nancial nancial statements statements statements were were were prepared prepared prepared in in in accordance accordance accordance with with with R R R O C GAAP The nancial nancial nancial statements statements statements for for for 2012-2013 were were were prepared prepared prepared in in in accordance accordance accordance with with with 2010 Taiwan-IFRSs Taiwan-IFRSs version version and the nancial nancial nancial statements statements statements for for 2014-2017 were were prepared prepared in in in accordance accordance with with 2013 Taiwan-IFRSs version 095
Note 2: Capacity includes wafers committed by Vanguard and SSMC *Glossary
1 1 Capital Structure Analysis
(1) Debt Ratio = Total Total Liabilities / Total Total Assets (2) Long-term Fund to Property Property Plant Plant and and Equipment Equipment Ratio Ratio = = (Shareholders’ Equity +
Noncurrent Liabilities) / Net Property Property Plant Plant and and Equipment Equipment 2 Liquidity Analysis
(1) Current Current Current Current Ratio Ratio = = Current Current Current Current Assets Assets / Current Current Current Current Liabilities (2) Quick Ratio Ratio = = = (Current Assets Assets - - Inventories - - Prepaid Expenses) / / / Current Current Current Current Current Liabilities Liabilities (3) Times Interest Interest Interest Earned = = Earnings before Interest Interest Interest and Taxes / / Interest Interest Interest Expenses
Expenses
3 Operating Performance
Analysis
(1) Average Average Average Collection Collection Turnover Turnover = = Net Sales Sales / / Average Average Average Trade Receivables
4 5 6 Pro tability Analysis
(1) Return on Total Total Assets Assets = (Net Income
+
Interest Expenses
* (1 (1 - Effective Tax
Rate)) / Average Total Total Assets Assets (2) Return on Equity Equity Attributable Attributable Attributable to to to Shareholders Shareholders Shareholders of of of the the the Parent
Parent
Parent
= Net Income
Attributable Attributable Attributable to to to Shareholders Shareholders Shareholders of of of the the the Parent
Parent
Parent
/ / Average Equity Equity Attributable Attributable Attributable to to to Shareholders Shareholders Shareholders of of of the the the Parent
Parent
Parent
(3) Operating Operating Income
Income
Income
Income
to to to Paid-in Paid-in Paid-in Paid-in Capital Capital Capital Capital Ratio= Operating Operating Income
Income
Income
Income
/ / / Paid-in Paid-in Paid-in Paid-in Capital Capital Capital Capital (4) Pre-tax Income
Income
Income
Income
Income
to to Paid-in Paid-in Paid-in Paid-in Capital Capital Capital Capital Ratio Ratio = = = Income
Income
Income
Income
Income
before Tax
/ / / Paid-in Paid-in Paid-in Paid-in Capital Capital Capital Capital (5) Net Net Net Net Margin = = Net Net Net Net Income
Income
Income
/ Net Net Net Net Sales (6) Earnings Per Share Share Share = = (Net Income
Income
Attributable to to Shareholders of of the Parent
- Preferred Stock Dividend) / Weighted Average Number of of Shares Outstanding
Cash Cash Flow Flow (1) Cash Cash Cash Cash Cash Flow Flow Flow Ratio Ratio = = Net Cash Cash Cash Cash Cash Provided by Operating Activities / / Current Liabilities (2) Cash Cash Cash Cash Cash Flow Flow Adequacy Ratio Ratio = = Five-year Five-year Sum Sum of of Cash Cash Cash Cash Cash from Operations
/ / Five-year Five-year Sum Sum of of Capital Expenditures Inventory Additions and Cash Cash Cash Cash Cash Dividend (3) Cash Cash Cash Cash Flow Reinvestment Ratio = (Cash Provided by Operating Activities - - Cash Cash Cash Cash Dividends)/
(Gross Property Plant and Equipment +
+
+
Long-term Investments +
+
+
Other Noncurrent Assets +
Working Capital)
Leverage
(1) Operating Leverage
Leverage
Leverage
= = (Net Sales - - Variable Cost) / / Income
Income
Income
from from from Operations
Operations
Operations
(2) Financial Leverage
Leverage
= = Income
Income
Income
from from from Operations
Operations
Operations
/ / (Income from from from Operations
Operations
Operations
- - Interest Expenses) (2) (3) (4) (5) (6) (7)
Days Sales Sales Sales Outstanding
= = = 365 / / / Average Average Average Average Average Collection Collection Turnover Turnover Turnover Average Average Average Average Average Inventory Inventory Inventory Inventory Turnover Turnover Turnover Turnover = = = Cost of Sales Sales / / / Average Average Average Average Average Inventory Inventory Inventory Inventory Average Average Average Average Average Average Inventory Inventory Inventory Inventory Turnover Turnover Turnover Turnover Days = = = 365 / / / Average Average Average Average Average Average Inventory Inventory Inventory Inventory Turnover Turnover Turnover Turnover Average Average Average Average Average Payment Turnover Turnover Turnover Turnover = = = Cost of Sales Sales / / / Average Average Average Average Average Trade Payables
Property Property Plant Plant and and Equipment Equipment Turnover Turnover = = Net Net Sales Sales / / Average Average Average Net Net Property Property Plant Plant and and Equipment Total Total Assets Assets Turnover = Net Sales / Average Total Total Assets Assets 