
Taiwan Semiconductor Manufacturing Company Limited and Subsidiaries
NOTES TO CONSOLIDATED FINANCIAL STATEMENTS
FOR THE YEARS ENDED DECEMBER 31, 2012 AND 2011
(Amounts in Thousands of New Taiwan Dollars, Unless Specified Otherwise)
-
1. GENERAL
2. SUMMARY OF SIGNIFICANT ACCOUNTING
POLICIES3. ACCOUNTING CHANGES
4. CASH AND CASH EQUIVALENTS
5. FINANCIAL ASSETS AND LIABILITIES AT
FAIR VALUE THROUGH PROFIT OR LOSS6. AVAILABLE-FOR-SALE FINANCIAL ASSETS
7. HELD-TO-MATURITY FINANCIAL ASSETS
8. ALLOWANCES FOR DOUBTFUL
RECEIVABLES, SALES RETURNS AND
OTHERS9. INVENTORIES
10. INVESTMENTS ACCOUNTED FOR USING
EQUITY METHOD11. HEDGING DERIVATIVE FINANCIAL
INSTRUMENTS12. FINANCIAL ASSETS CARRIED AT COST
13. PROPERTY, PLANT AND EQUIPMENT
14. DEFERRED CHARGES, NET
15. SHORT-TERM LOANS
16. BONDS PAYABLE
17. LONG-TERM BANK LOANS
18. OTHER LONG-TERM PAYABLES
-
19. PENSION PLANS
20. INCOME TAX
21. LABOR COST, DEPRECIATION AND
AMORTIZATION22. SHAREHOLDERS’ EQUITY
23. STOCK-BASED COMPENSATION PLANS
24. TREASURY STOCK
25. EARNINGS PER SHARE
26. DISCLOSURES FOR FINANCIAL
INSTRUMENTS27. RELATED PARTY TRANSACTIONS
28. PLEDGED OR MORTGAGED ASSETS
29. SIGNIFICANT LONG-TERM LEASES
30. SIGNIFICANT COMMITMENTS AND
CONTINGENCIES31. EXCHANGE RATE INFORMATION OF
FOREIGN-CURRENCY FINANCIAL ASSETS
AND LIABILITIES32. PRE-DISCLOSURE OF THE ADOPTION OF
INTERNATIONAL FINANCIAL REPORTING
STANDARDS33. ADDITIONAL DISCLOSURES
34. OPERATING SEGMENTS INFORMATION
35. THE AUTHORIZATION OF FINANCIAL
STATEMENTS
1. GENERAL
Taiwan Semiconductor Manufacturing Company Limited (TSMC), a Republic of China (R.O.C.) corporation, was incorporated on February 21, 1987. TSMC is a dedicated foundry in the semiconductor industry which engages mainly in the manufacturing, selling, packaging, testing and computer-aided design of integrated circuits and other semiconductor devices and the manufacturing of masks. Beginning in 2010, TSMC also engages in the researching, developing, designing, manufacturing and selling of solid state lighting devices and related applications products and systems, and renewable energy and efficiency related technologies and products. In August 2011, TSMC transferred its solid state lighting and solar businesses into its wholly-owned, newly incorporated subsidiaries, TSMC Solid State Lighting Ltd. (TSMC SSL) and TSMC Solar Ltd. (TSMC Solar), respectively.
On September 5, 1994, TSMC's shares were listed on the Taiwan Stock Exchange (TWSE). On October 8, 1997, TSMC listed some of its shares of stock on the New York Stock Exchange (NYSE) in the form of American Depositary Shares (ADSs).
As of December 31, 2012 and 2011, TSMC and its subsidiaries had 39,267 and 35,457 employees, respectively.
2. SUMMARY OF SIGNIFICANT ACCOUNTING POLICIES
The consolidated financial statements are presented in conformity with the Guidelines Governing the Preparation of Financial Reports by Securities Issuers and accounting principles generally accepted in the R.O.C.
For the convenience of readers, the accompanying consolidated financial statements have been translated into English from the original Chinese version prepared and used in the R.O.C. If there is any conflict between the English version and the original Chinese version or any difference in the interpretation of the two versions, the Chinese-language consolidated financial statements shall prevail.
Significant accounting policies are summarized as follows:
Principles of ConsolidationThe accompanying consolidated financial statements include the accounts of all directly and indirectly majority owned subsidiaries of TSMC, and the accounts of investees in which TSMC’s ownership percentage is less than 50% but over which TSMC has a controlling interest. All significant intercompany balances and transactions are eliminated upon consolidation.
The consolidated entities were as follows:
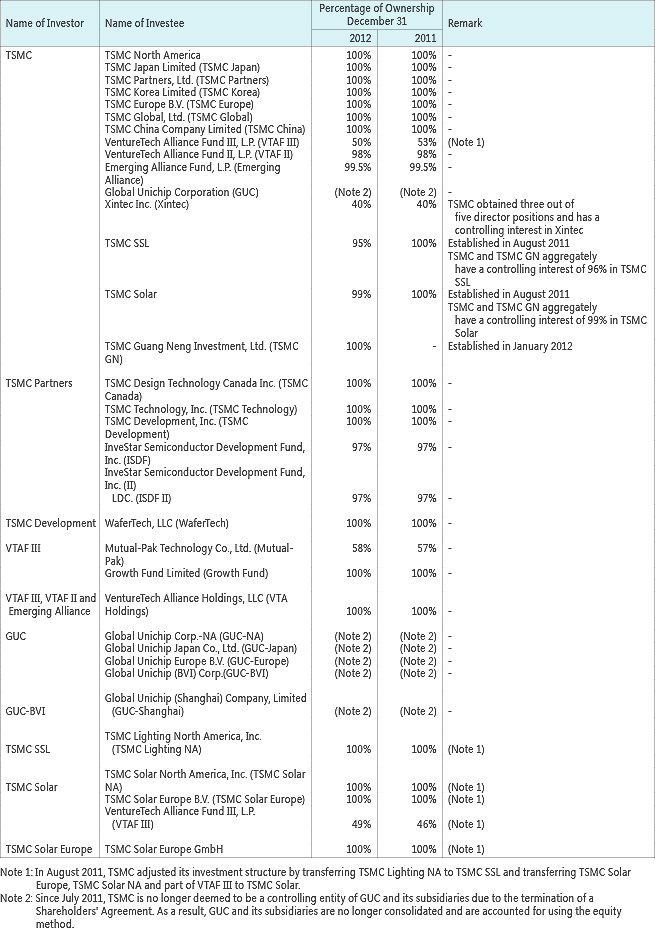
The following diagram presents information regarding the relationship and ownership percentages between TSMC and its consolidated investees as of December 31, 2012:
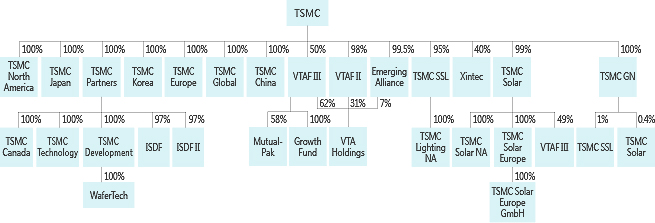
Since July 2011, TSMC is no longer deemed to be a controlling entity of GUC and its subsidiaries due to the termination of a Shareholders’ Agreement. As a result, GUC and its subsidiaries are no longer consolidated and are accounted for using the equity method.
TSMC North America is engaged in selling and marketing of integrated circuits and semiconductor devices. TSMC Japan, TSMC Korea and TSMC Europe are engaged mainly in marketing or customer service, engineering and technical supporting activities. TSMC Partners is engaged in investment in companies involved in the design, manufacture, and other related business in the semiconductor industry. TSMC Global, TSMC Development and TSMC GN are engaged in investing activities. TSMC China is engaged in the manufacturing and selling of integrated circuits pursuant to the orders from and product design specifications provided by customers. Emerging Alliance, VTAF II, VTAF III, VTA Holdings, ISDF, ISDF II and Growth Fund are engaged in investing in new start-up technology companies. TSMC Canada and TSMC Technology are engaged mainly in engineering support activities. WaferTech is engaged in the manufacturing, selling, testing and computer-aided designing of integrated circuits and other semiconductor devices. Xintec is engaged in the provision of wafer packaging service. TSMC SSL is engaged in researching, developing, designing, manufacturing and selling solid state lighting devices and related applications products and systems. TSMC Lighting NA is engaged in selling and marketing of solid state lighting related products. TSMC Solar is engaged in researching, developing, designing, manufacturing and selling renewable energy and energy saving related technologies and products. TSMC Solar NA is engaged in selling and marketing of solar related products. TSMC Solar Europe is engaged in investing activities of solar related business. TSMC Solar Europe GmbH is engaged in the selling and customer service of solar cell modules and related products. Mutual-Pak is engaged in the manufacturing and selling of electronic parts and researching, developing and testing of RFID.
TSMC together with its subsidiaries are hereinafter referred to collectively as the “Company.”
Minority interests in the aforementioned subsidiaries are presented as a separate component of shareholders’ equity.
Foreign-currency Transactions and Translation of Foreign-currency Financial StatementsForeign-currency transactions other than derivative contracts are recorded in New Taiwan dollars at the rates of exchange in effect when the transactions occur. Exchange gains or losses derived from foreign-currency transactions or monetary assets and liabilities denominated in foreign currencies are recognized in earnings.
At the balance sheet date, monetary assets and liabilities denominated in foreign currencies are revalued at prevailing exchange rates with the resulting gains or losses recognized in earnings.
The financial statements of foreign subsidiaries are translated into New Taiwan dollars at the following exchange rates: Assets and liabilities - spot rates at year-end; shareholders’ equity - historical rates; income and expenses - average rates during the year. The resulting translation adjustments are recorded as a separate component of shareholders’ equity.
Use of EstimatesThe preparation of consolidated financial statements in conformity with the aforementioned guidelines and principles requires management to make reasonable assumptions and estimates of matters that are inherently uncertain. The actual results may differ from management’s estimates.
Classification of Current and Noncurrent Assets and LiabilitiesCurrent assets are assets held for trading purposes and assets expected to be converted to cash, sold or consumed within one year from the balance sheet date. Current liabilities are obligations incurred for trading purposes and obligations expected to be settled within one year from the balance sheet date. Assets and liabilities that are not classified as current are noncurrent assets and liabilities, respectively.
Cash EquivalentsRepurchase agreements collateralized by corporate bonds, short-term commercial paper and government bonds acquired with maturities of less than three months from the date of purchase are classified as cash equivalents. The carrying amount approximates fair value due to their short term nature.
Financial Assets/Liabilities at Fair Value through Profit or LossDerivatives that do not meet the criteria for hedge accounting are initially recognized at fair value, with transaction costs expensed as incurred. The derivatives are remeasured at fair value subsequently with changes in fair value recognized in earnings. A regular way purchase or sale of financial assets is accounted for using settlement date accounting.
Fair value is estimated using valuation techniques incorporating estimates and assumptions that are consistent with prevailing market conditions. When the fair value is positive, the derivative is recognized as a financial asset; when the fair value is negative, the derivative is recognized as a financial liability.
Available-for-sale Financial AssetsAvailable-for-sale financial assets are initially recognized at fair value plus transaction costs that are directly attributable to the acquisition. Changes in fair value from subsequent remeasurement are reported as a separate component of shareholders’ equity. The corresponding accumulated gains or losses are recognized in earnings when the financial asset is derecognized from the balance sheet. A regular way purchase or sale of financial assets is accounted for using settlement date accounting.
Fair value is determined as follows: Money market funds - net asset values at the end of the year; and publicly traded stocks - closing prices at the end of the year.
Cash dividends are recognized as investment income upon resolution of shareholders of an investee. Stock dividends are recorded as an increase in the number of shares held and do not affect investment income. The cost per share is recalculated based on the new total number of shares.
If there is objective evidence which indicates that a financial asset is impaired, a loss is recognized. For equity securities, if the fair value subsequently increases, the increase in value is recorded in shareholders’ equity.
Held-to-maturity Financial AssetsDebt securities for which the Company has a positive intention and ability to hold to maturity are categorized as held-to-maturity financial assets and are carried at amortized cost. Those financial assets are initially recognized at fair value plus transaction costs that are directly attributable to the acquisition. Gains or losses are recognized at the time of derecognition, impairment or amortization. A regular way purchase or sale of financial assets is accounted for using settlement date accounting.
If there is objective evidence which indicates that a financial asset is impaired, a loss is recognized. If, in a subsequent period, the amount of the impairment loss decreases and the decrease is clearly attributable to an event which occurred after the impairment loss was recognized, the previously recognized impairment loss is reversed to the extent of the decrease. The reversal may not result in a carrying amount that exceeds the amortized cost that would have been determined as if no impairment loss had been recognized.
Hedging Derivative Financial InstrumentsHedge derivatives are mainly derivatives instruments that are for cash flow hedge purposes and determined to be an effective hedge. The portion of the gain or loss on the hedging instrument that is determined to be an effective hedge is recognized in shareholders’ equity. The amount recognized in shareholders’ equity is recognized in profit or loss in the same year or year during which the hedged forecast transaction or an asset or liability arising from the hedged forecast transaction affects profit or loss. However, if all or a portion of a loss recognized in shareholders’ equity is not expected to be recovered in the future, the amount that is not expected to be recovered is reclassified into profit or loss.
Financial Assets Carried at CostInvestments for which the Company does not exercise significant influence and that do not have a quoted market price in an active market and whose fair value cannot be reliably measured, such as non-publicly traded stocks and mutual funds, are carried at their original cost. The costs of non-publicly traded stocks and mutual funds are determined using the weighted-average method. If there is objective evidence which indicates that a financial asset is impaired, a loss is recognized. A subsequent reversal of such impairment loss is not allowed.
The accounting treatment for cash dividends and stock dividends arising from financial assets carried at cost is the same as that for cash and stock dividends arising from available-for-sale financial assets.
Allowance for Doubtful ReceivablesAn allowance for doubtful receivables is provided based on a review of the collectability of receivables. The Company assesses the collectability of receivables by performing the account aging analysis and examining current trends in the credit quality of its customers.
TSMC’s provision was originally set at 1% of the amount of outstanding receivables. On January 1, 2011, the Company adopted the third revision of Statement of Financial Accounting Standards (SFAS) No. 34, “Financial Instruments: Recognition and Measurement (SFAS No. 34).” One of the main revisions is that the impairment of receivables originated by the Company is subject to the provisions of SFAS No. 34. Accordingly, the Company evaluates for indication of impairment of accounts receivable based on an individual and collective basis at the end of each reporting period. When objective evidence indicates that the estimated future cash flow of accounts receivable decreases as a result of one or more events that occurred after the initial recognition of the accounts receivable, such accounts receivable are deemed to be impaired.
Because of the Company’s short average collection period, the amount of the impairment loss recognized is the difference between the carrying amount of accounts receivable and estimated future cash flows without considering the discounting effect. Changes in the carrying amount of the allowance account are recognized as bad debt expense which is recorded in the operating expenses - general and administrative. When accounts receivable are considered uncollectable, the amount is written off against the allowance account.
InventoriesInventories are recorded at standard cost and adjusted to approximate weighted-average cost on the balance sheet date.
Inventories are stated at the lower of cost or net realizable value. Inventory write-downs are made on an item-by-item basis, except where it may be appropriate to group similar or related items. Net realizable value is the estimated selling price of inventories less all estimated costs of completion and necessary selling costs.
Investments Accounted for Using Equity MethodInvestments in companies wherein the Company exercises significant influence over the operating and financial policy decisions are accounted for using the equity method. The Company’s share of the net income or net loss of an investee is recognized in the “equity in earnings/losses of equity method investees, net” account. The cost of an investment shall be analyzed and the cost of investment in excess of the fair value of identifiable net assets acquired, representing goodwill, shall not be amortized. If the fair value of identifiable net assets acquired exceeds the cost of investment, the excess shall be proportionately allocated as reductions to fair values of non-current assets (except for financial assets other than investments accounted for using the equity method and deferred income tax assets).
When an indication of impairment is identified, the carrying amount of the investment is reduced by the difference of the carrying amount (including goodwill) of each investment and its own recoverable amount, with the related impairment loss recognized in earnings. If the recoverable amount increases in a subsequent period, the amount previously recognized as impairment would be reversed and recognized as a gain.
When the Company subscribes for additional investee’s shares at a percentage different from its existing ownership percentage, the resulting carrying amount of the investment in the investee differs from the amount of the Company’s share of the investee’s equity. The Company records such a difference as an adjustment to long-term investments with the corresponding amount charged or credited to capital surplus. Cash dividends received from an investee shall reduce the carrying amount of the investment. Stock dividends are recorded as an increase in the number of shares held and do not affect investment income.
Gains or losses on sales from the Company to equity method investees or from equity method investees to the Company are deferred in proportion to the Company’s ownership percentages in the investees until such gains or losses are realized through transactions with third parties.
If an investee’s functional currency is a foreign currency, differences will result from the translation of the investee’s financial statements into the reporting currency of the Company. Such differences are charged or credited to cumulative translation adjustments, a separate component of shareholders’ equity.
Property, Plant and Equipment, Assets Leased to Others and Idle AssetsProperty, plant and equipment and assets leased to others are stated at cost less accumulated depreciation. Properties covered by agreements qualifying as capital leases are carried at the lower of the leased equipment’s market value or the present value of the minimum lease payments at the inception date of the lease, with the corresponding amount recorded as obligations under capital leases. Borrowing costs directly attributable to the acquisition or construction of property, plant and equipment are capitalized as part of the cost of those assets. When an indication of impairment is identified, any excess of the carrying amount of an asset over its recoverable amount is recognized as a loss. If the recoverable amount increases in a subsequent period, the amount previously recognized as impairment would be reversed and recognized as a gain. However, the adjusted amount may not exceed the carrying amount that would have been determined, net of depreciation, as if no impairment loss had been recognized. Significant additions, renewals and betterments incurred during the construction period are capitalized. Maintenance and repairs are expensed as incurred.
Depreciation is computed using the straight-line method over the following estimated service lives: land improvements - 20 years; buildings - 10 to 20 years; machinery and equipment - 3 to 5 years; office equipment - 3 to 15 years; and leased assets - 20 years.
Upon sale or disposal of property, plant and equipment and assets leased to others, the related cost and accumulated depreciation are deducted from the corresponding accounts, with any gain or loss recorded as non-operating gains or losses in the year of sale or disposal.
When property, plant and equipment are determined to be idle or useless, they are transferred to idle assets at the lower of the net realizable value or carrying amount. Depreciation on the idle assets is provided continuously, and the idle assets are tested for impairment on a periodical basis.
Intangible AssetsGoodwill represents the excess of the consideration paid for acquisition over the fair value of identifiable net assets acquired. Goodwill is no longer amortized and instead is tested for impairment annually, or more frequently if events or changes in circumstances suggest that the carrying amount may not be recoverable. If an event occurs or circumstances change which indicate that the fair value of goodwill is more likely than not below its carrying amount, an impairment loss is recognized. A subsequent reversal of such impairment loss is not allowed.
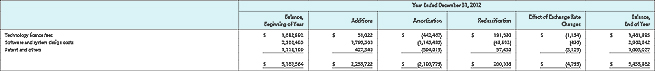
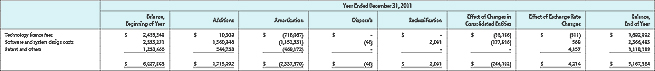
Deferred charges consist of technology license fees, software and system design costs and patent and others. The amounts are amortized over the following periods: Technology license fees - the estimated life of the technology or the term of the technology transfer contract; software and system design costs - 2 to 5 years; patent and others - the economic life or contract period. When an indication of impairment is identified, any excess of the carrying amount of an asset over its recoverable amount is recognized as a loss. If the recoverable amount increases in a subsequent period, the previously recognized impairment loss would be reversed and recognized as a gain. However, the adjusted amount may not exceed the carrying amount that would have been determined, net of amortization, as if no impairment loss had been recognized.
Expenditures related to research activities and those related to development activities that do not meet the criteria for capitalization are charged to expense when incurred.
Pension CostsFor employees who participate in defined contribution pension plans, pension costs are recorded based on the actual contributions made to employees’ individual pension accounts during their service periods. For employees who participate in defined benefit pension plans, pension costs are recorded based on actuarial calculations.
If additional accrued pension cost based on actuarial calculation is not in excess of the sum of the unamortized balance of prior service costs and unrecognized net transition obligation, “deferred pension cost” will be debited. Otherwise, the excess amount should be debited to “net loss not recognized as pension cost” as a deduction in stockholders’ equity.
Income TaxThe Company applies an inter-period allocation for its income tax whereby deferred income tax assets and liabilities are recognized for the tax effects of temporary differences, net operating loss carryforwards and unused tax credits. Valuation allowances are provided to the extent, if any, that it is more likely than not that deferred income tax assets will not be realized. A deferred tax asset or liability is classified as current or noncurrent in accordance with the classification of its related asset or liability. However, if a deferred tax asset or liability does not relate to an asset or liability in the financial statements, then it is classified as either current or noncurrent based on the expected length of time before it is realized or settled.
Any tax credits arising from purchases of machinery and equipment, research and development expenditures and personnel training expenditures are recognized using the flow-through method.
Adjustments of prior years’ tax liabilities are added to or deducted from the current year’s tax provision.
Income tax on unappropriated earnings (excluding earnings from foreign consolidated subsidiaries) at a rate of 10% is expensed in the year of shareholder approval which is the year subsequent to the year the earnings are generated.
Stock-based CompensationEmployee stock options that were granted or modified in the period from January 1, 2004 to December 31, 2007 are accounted for by the interpretations issued by the Accounting Research and Development Foundation of the Republic of China. The Company adopted the intrinsic value method and any compensation cost determined using this method is recognized in earnings over the employee vesting period. Employee stock option plans that were granted or modified after December 31, 2007 are accounted for using fair value method in accordance with SFAS No. 39, “Accounting for Share-based Payment.” Under the statement, the value of the stock options granted, which is equal to the best available estimate of the number of stock options expected to vest multiplied by the grant-date fair value, is expensed on a straight-line basis over the vesting period, with a corresponding adjustment to capital surplus - employee stock options. The estimate is revised if subsequent information indicates that the number of stock options expected to vest differs from previous estimates.
Treasury StockTreasury stock represents the outstanding shares that the Company buys back from market, which is stated at cost and shown as a deduction in shareholders’ equity. When the Company retires treasury stock, the treasury stock account is reduced and the common stock as well as the capital surplus - additional paid-in capital are reversed on a pro rata basis. When the book value of the treasury stock exceeds the sum of the par value and additional paid-in capital, the difference is charged to capital surplus - treasury stock transactions and to retained earnings for any remaining amount. While disposing of the treasury stock, the treasury stock shall be reversed, and if the disposal value is greater than the book value, the amount in excess of the book value shall be credited to additional paid-in capital - treasury stock.
Revenue Recognition and Allowance for Sales Returns and OthersThe Company recognizes revenue when evidence of an arrangement exists, the rewards of ownership and significant risk of the goods has been transferred to the buyer, price is fixed or determinable, and collectability is reasonably assured. Provisions for estimated sales returns and other allowances are recorded in the year the related revenue is recognized, based on historical experience, management’s judgment, and any known factors that would significantly affect the allowance.
Sales prices are determined using fair value taking into account related sales discounts agreed to by the Company and its customers. Sales agreements typically provide that payment is due 30 days from invoice date for a majority of the customers and 30 to 45 days after the end of the month in which sales occur for some customers. Since the receivables from sales are collectible within one year and such transactions are frequent, fair value of the receivables is equivalent to the nominal amount of the cash to be received.
3. ACCOUNTING CHANGES
On January 1, 2011, the Company prospectively adopted the newly revised SFAS No. 34, “Financial Instruments: Recognition and Measurement.” The main revisions include (1) finance lease receivables are now covered by SFAS No. 34; (2) the scope of the applicability of SFAS No. 34 to insurance contracts is amended; (3) loans and receivables originated by the Company are now covered by SFAS No. 34; (4) additional guidelines on impairment testing of financial assets carried at amortized cost when the debtor has financial difficulties and the terms of obligations have been modified; and (5) accounting treatment by a debtor for modifications in the terms of obligations. This accounting change did not have a significant effect on the Company’s consolidated financial statements as of and for the year ended December 31, 2011.
On January 1, 2011, the Company adopted the newly issued SFAS No. 41, “Operating Segments.” The statement requires identification and disclosure of operating segments on the basis of how the Company’s chief operating decision maker regularly reviews information in order to allocate resources and assess performance. This statement supersedes SFAS No. 20, “Segment Reporting” and the Company conformed to the disclosure requirement and provided the operating segments disclosure in the consolidated financial statements accordingly.
4. CASH AND CASH EQUIVALENTS
| December 31 | ||||||||||||
|---|---|---|---|---|---|---|---|---|---|---|---|---|
| 2012 | 2011 | |||||||||||
| Cash and deposits in banks Repurchase agreements collateralized by corporate bonds Repurchase agreements collateralized by short-term commercial paper Repurchase agreements collateralized by government bonds |
|
|
||||||||||
5. FINANCIAL ASSETS AND LIABILITIES AT FAIR VALUE THROUGH PROFIT OR
LOSS
| December 31 | ||||||||
|---|---|---|---|---|---|---|---|---|
| 2012 | 2011 | |||||||
| Trading financial assets Forward exchange contracts Cross currency swap contracts |
|
|
||||||
| Trading financial liabilities Forward exchange contracts Cross currency swap contracts |
|
|
||||||
The Company entered into derivative contracts during the years ended December 31, 2012 and 2011 to manage exposures due to fluctuations of foreign exchange rates. The derivative contracts entered into by the Company did not meet the criteria for hedge accounting. Therefore, the Company did not apply hedge accounting treatment for derivative contracts.
Outstanding forward exchange contracts consisted of the following:
| Maturity Date | Contract Amount (In Thousands) |
|
|---|---|---|
| December 31, 2012 Sell NT$/Buy EUR Sell US$/Buy RMB Sell US$/Buy NT$ Sell NT$/Buy US$ Sell NT$/Buy JPY |
January 2013 January 2013 January 2013 to March 2013 January 2013 January 2013 |
NT$9,417,062/EUR246,000 US$20,000/RMB124,735 US$13,700/NT$398,239 NT$590,403/US$20,400 NT$44,110/JPY130,000 |
| December 31, 2011 Sell EUR/Buy NT$ Sell US$/Buy NT$ Sell US$/Buy EUR Sell US$/Buy JPY Sell RMB/Buy US$ Sell NT$/Buy US$ |
January 2012 January 2012 to February 2012 January 2012 January 2012 January 2012 January 2012 to February 2012 |
EUR38,600/NT$1,528,206 US$16,900/NT$510,122 US$2,082/EUR1,591 US$3,335/JPY259,830 RMB1,118,705/US$177,000 NT$163,491/US$5,400 |
Outstanding cross currency swap contracts consisted of the following:
| Maturity Date | Contract Amount (In Thousands) |
Range of Interest Rates Paid |
Range of Interest Rates Received |
|---|---|---|---|
| December 31, 2012 January 2013 January 2013 |
US$275,000/NT$7,986,190 NT$1,083,139/US$37,280 |
0.14%~0.17% - |
- 0.06% |
| December 31, 2011 January 2012 |
NT$420,431/US$13,880 |
- |
0.48% |
For the years ended December 31, 2012 and 2011, a net loss on derivative financial instruments was NT$252,531 thousand and a net gain on derivative financial instruments was NT$507,432 thousand, respectively.
6. AVAILABLE-FOR-SALE FINANCIAL ASSETS
| December 31 | ||||||||
|---|---|---|---|---|---|---|---|---|
| 2012 | 2011 | |||||||
| Publicly traded stocks Money market funds |
|
|
||||||
| Current portion |
|
|
||||||
In October 2012, the Company invested ASML Holding N.V. (ASML) for EUR837,816 thousand to acquire 5% of equity with a lock-up period of 2.5 years.
For the year ended December 31, 2012, the Company recognized an impairment loss on some of the overseas publicly traded stocks in the amount of NT$2,677,529 thousand due to the significant decline in fair value.
7. HELD-TO-MATURITY FINANCIAL ASSETS
| December 31 | ||||||||
|---|---|---|---|---|---|---|---|---|
| 2012 | 2011 | |||||||
| Corporate bonds Government bonds |
|
|
||||||
| Current portion |
|
|
||||||
8. ALLOWANCES FOR DOUBTFUL RECEIVABLES, SALES RETURNS AND OTHERS
Movements of the allowance for doubtful receivables were as follows:
| Years Ended December 31 | ||||||||||||||
|---|---|---|---|---|---|---|---|---|---|---|---|---|---|---|
| 2012 | 2011 | |||||||||||||
| Balance, beginning of year Provision (reversal) Write-off Effect of changes in consolidated entities Effect of exchange rate changes Balance, end of year |
|
|
||||||||||||
Movements of the allowance for sales returns and others were as follows:
| Years Ended December 31 | ||||||||||||
|---|---|---|---|---|---|---|---|---|---|---|---|---|
| 2012 | 2011 | |||||||||||
| Balance, beginning of year Provision Write-off Effect of exchange rate changes Balance, end of year |
|
|
||||||||||
9. INVENTORIES
| December 31 | ||||||||||||
|---|---|---|---|---|---|---|---|---|---|---|---|---|
| 2012 | 2011 | |||||||||||
| Finished goods Work in process Raw materials Supplies and spare parts |
|
|
||||||||||
Write-down of inventories to net realizable value in the amount of NT$1,558,915 thousand and NT$35,316 thousand, respectively, were included in the cost of sales for the years ended December 31, 2012 and 2011.
10. INVESTMENTS ACCOUNTED FOR USING EQUITY METHOD
| December 31 | ||||
|---|---|---|---|---|
| 2012 | 2011 | |||
| Carrying Amount |
% of Ownership |
Carrying Amount |
% of Ownership |
|
| Vanguard International Semiconductor Corporation
(VIS) |
$9,462,038 |
40 |
$8,988,007 |
39 |
| Systems on Silicon Manufacturing Company Pte Ltd.
(SSMC) |
6,710,956 |
39 |
6,289,429 |
39 |
| Motech Industries, Inc. (Motech) | 2,998,413 | 20 | 5,612,344 | 20 |
| VisEra Holding Company (VisEra Holding) | 3,035,641 | 49 | 2,853,364 | 49 |
| GUC | 1,222,972 | 35 | 1,157,188 | 35 |
| Mcube Inc. (Mcube) | - |
25 | - |
25 |
$23,430,020 |
$24,900,332 |
|||
Since July 2011, TSMC is no longer deemed to be a controlling entity of GUC and its subsidiaries due to the termination of a Shareholders’ Agreement. As a result, GUC and its subsidiaries are no longer consolidated and are accounted for using the equity method.
For the year ended December 31, 2012, the Company recognized an impairment loss in the amount of NT$1,186,674 thousand, due to the lower estimated recoverable amount compared with the carrying amount of its investments in stocks traded on the Taiwan GreTai Securities Market.
For the years ended December 31, 2012 and 2011, equity in earnings of equity method investees was a net gain of NT$2,028,611 thousand and NT$897,611 thousand, respectively.
As of December 31, 2012 and 2011, the quoted market price of publicly traded stocks in unrestricted investments accounted for using the equity method (VIS and GUC) were NT$17,350,833 thousand and NT$11,273,200 thousand, respectively.
Movements of the difference between the cost of investments and the Company’s share in investees’ net
assets allocated to depreciable assets were as follows:
| Years Ended December 31 | ||||||||
|---|---|---|---|---|---|---|---|---|
| 2012 | 2011 | |||||||
| Balance, beginning of year Amortization Balance, end of year |
|
|
||||||
As of December 31, 2012 and 2011, balance of the aforementioned difference allocated to goodwill was NT$1,415,565 thousand. There was no acquisition or impairment in goodwill for the years ended December 31, 2012 and 2011.
11. HEDGING DERIVATIVE FINANCIAL INSTRUMENTS
| December 31 | ||||
|---|---|---|---|---|
| 2012 | 2011 | |||
| Hedging derivative financial liabilities | ||||
| Interest rate swap contract |
|
|
||
The Company entered into forward exchange contracts to hedge cash flow risk arising from foreign exchange rate fluctuations of an expected equity security transaction. The forward exchange contract was due in October 2012. For the year ended December 31, 2012, the adjustment to shareholders’ equity amounted to a net gain of NT$8,833 thousand for the above forward exchange contracts.
The Company’s long-term bank loans bear floating interest rates; therefore, changes in the market interest rate may cause future cash flows to be volatile. Accordingly, the Company entered into an interest rate swap contract in order to hedge cash flow risk caused by floating interest rates. The interest rate swap contract of the Company was due in August 2012.
The outstanding interest rate swap contract consisted of the following:
| Contract Amount (In Thousands) |
Maturity Date | Range of Interest Rates Paid |
Range of Interest Rates Received |
|---|---|---|---|
| December 31, 2011 | |||
| NT$80,000 | August 31, 2012 | 1.38% | 0.63%~0.86% |
For the years ended December 31, 2012 and 2011, the adjustment to shareholders’ equity amounted to a net gain of NT$5 thousand and a net loss of NT$98 thousand, respectively; and the amount removed from shareholders’ equity and recognized as a loss from the above interest rate swap contract amounted to NT$227 thousand and NT$680 thousand, respectively.
12. FINANCIAL ASSETS CARRIED AT COST
| December 31 | ||||||||
|---|---|---|---|---|---|---|---|---|
| 2012 | 2011 | |||||||
| Non-publicly traded stocks Mutual funds |
|
|
||||||
The common stock of InvenSense, Inc. and Audience, Inc. was listed on the NYSE and NASDAQ in November 2011 and in May 2012, respectively. Thus, the Company reclassified the aforementioned investments from financial assets carried at cost to available-for-sale financial assets.
For the years ended December 31, 2012 and 2011, the Company recognized impairment on financial assets carried at cost of NT$367,399 thousand and NT$265,515 thousand, respectively.
13. PROPERTY, PLANT AND EQUIPMENT
The Company entered into agreements to lease buildings that qualify as capital leases. The term of the leases is from December 2003 to November 2018.
As of December 31, 2012, future lease payments were as follows:
| Year | Amount | |||||||
|---|---|---|---|---|---|---|---|---|
| 2013 2014 2015 2016 2017 2018 and thereafter |
|
During the years ended December 31, 2012 and 2011, the Company capitalized the borrowing costs
directly attributable to the acquisition or construction of property, plant and equipment. Information about
capitalized interest was as follows:
| Years Ended December 31 | ||||||
|---|---|---|---|---|---|---|
| 2012 | 2011 | |||||
| Capitalized interest Capitalization rates |
|
|
||||
14. DEFERRED CHARGES, NET
15. SHORT-TERM LOANS
| December 31 | ||||
|---|---|---|---|---|
| 2012 | 2011 | |||
| Unsecured loans: US$1,195,500 thousand, due in January 2013, and annual interest at 0.39%~0.58% in 2012; US$856,000 thousand, due by February 2012, and annual interest at 0.45%~1.00% in 2011. |
|
|
||
16. BONDS PAYABLE
| December 31 | ||||||
|---|---|---|---|---|---|---|
| 2012 | 2011 | |||||
| Domestic unsecured bonds: Issued in September 2011 and repayable in September 2016, 1.40% interest payable annually |
|
|
||||
| Issued in September 2011 and repayable in September 2018, 1.63% interest payable annually |
|
|
||||
| Issued in January 2012 and repayable in January 2017, 1.29% interest payable annually |
|
|
||||
| Issued in January 2012 and repayable in January 2019, 1.46% interest payable annually |
|
|
||||
| Issued in August 2012 and repayable in August 2017, 1.28% interest payable annually |
|
|
||||
| Issued in August 2012 and repayable in August 2019, 1.40% interest payable annually |
|
|
||||
| Issued in September 2012 and repayable in September 2017, 1.28% interest payable annually |
|
|
||||
| Issued in September 2012 and repayable in September 2019, 1.39% interest payable annually |
|
|
||||
| Issued in October 2012 and repayable in October 2022, 1.53% interest payable annually |
|
|
||||
| Issued in January 2002 and repayable in January 2012, 3.00% interest payable annually |
|
|
||||
| Current portion |
|
|
||||
With the approval from the Financial Supervisory Commission (FSC), the Company issued domestic unsecured bonds in the amount of NT$23,600,000 thousand in January 2013 and is expected to issue domestic unsecured bonds in the amount of NT$21,400,000 thousand in February 2013.
The provision of a loan guarantee to TSMC Global, a subsidiary of TSMC, for its issuance of unsecured corporate bonds for an amount not to exceed US$1,500,000 thousand had been approved in the meeting of the Board of Directors of TSMC held on February 5, 2013.
17. LONG-TERM BANK LOANS
| December 31 | ||||||||||||||||||||||
|---|---|---|---|---|---|---|---|---|---|---|---|---|---|---|---|---|---|---|---|---|---|---|
| 2012 | 2011 | |||||||||||||||||||||
| Bank loans for working capital: Repayable in full in one lump sum payment in June 2016, annual interest at 1.08%-1.21% in 2012 and 1.00%-1.08% in 2011 Repayable in full in one lump sum payment in March 2014, annual interest at 1.16%-1.18% in 2012 and 1.02%-1.16% in 2011 Repayable from July 2012 in 16 quarterly installments, annual interest at 1.21%-1.24% in 2012 and 1.11%-1.21% in 2011 Repayable from September 2012 in 16 quarterly installments, annual interest at 1.21%-1.24% in 2012 and 1.13%-1.21% in 2011 Repayable from October 2013 in 16 quarterly installments, annual interest at 1.23%-1.24% in 2012 |
|
|
||||||||||||||||||||
| Current portion |
|
|
||||||||||||||||||||
Pursuant to the loan agreements, financial ratios calculated based on semi-annual and annual financial statements of Xintec must comply with predetermined financial covenants. As of December 31, 2012, Xintec was in compliance with all such financial covenants.
As of December 31, 2012, future principal repayments for the long-term bank loans were as follows:
| Year of Repayment | Amount | ||||||
|---|---|---|---|---|---|---|---|
| 2013 2014 2015 2016 2017 |
|
18. OTHER LONG-TERM PAYABLES
| December 31 | ||||||||||
|---|---|---|---|---|---|---|---|---|---|---|
| 2012 | 2011 | |||||||||
| Payables for acquisition of property, plant and equipment (Note 30g) Payables for software and system design costs Payables for technology transfer |
|
|
||||||||
| Current portion (classified under accrued expenses and other current liabilities) |
|
|
||||||||
As of December 31, 2012, future payments for other long-term payables were as follows:
| Year of Payment | Amount | |||||
|---|---|---|---|---|---|---|
| 2013 2014 2015 2016 |
|
19. PENSION PLANS
The pension mechanism under the Labor Pension Act (the “Act”) is deemed a defined contribution plan. Pursuant to the Act, TSMC, GUC, Xintec, Mutual-Pak, TSMC SSL and TSMC Solar have made monthly contributions equal to 6% of each employee’s monthly salary to employees’ pension accounts. Furthermore, TSMC North America, TSMC China, TSMC Europe, TSMC Canada, TSMC Solar NA and TSMC Solar Europe GmbH are required by local regulations to make monthly contributions at certain percentages of the basic salary of their employees. Pursuant to the aforementioned Act and local regulations, the Company recognized pension costs of NT$1,403,507 thousand and NT$1,297,583 thousand for the years ended December 31, 2012 and 2011, respectively.
TSMC, GUC, Xintec, TSMC SSL and TSMC Solar have defined benefit plans under the Labor Standards Law that provide benefits based on an employee’s length of service and average monthly salary for the six-month period prior to retirement. The aforementioned companies contribute an amount equal to 2% of salaries paid each month to their respective pension funds (the Funds), which are administered by the Labor Pension Fund Supervisory Committee (the Committee) and deposited in the Committee’s name in the Bank of Taiwan.
Pension information on the defined benefit plans is summarized as follows:
a. Components of net periodic pension cost for the year
| 2012 | 2011 | |||||||||||
|---|---|---|---|---|---|---|---|---|---|---|---|---|
| Service cost Interest cost Projected return on plan assets Amortization Net periodic pension cost |
|
|
b. Reconciliation of funded status of the plans and accrued pension cost at December 31, 2012 and 2011
| 2012 | 2011 | |
|---|---|---|
| Benefit obligation | ||
| Vested benefit obligation | $427,874 | $313,463 |
| Nonvested benefit obligation | 6,069,738 |
5,456,913 |
| Accumulated benefit obligation | 6,497,612 | 5,770,376 |
| Additional benefits based on future salaries | 3,635,749 |
3,443,749 |
| Projected benefit obligation | 10,133,361 | 9,214,125 |
| Fair value of plan assets | (3,352,567) |
(3,120,665) |
| Funded status | 6,780,794 | 6,093,460 |
| Unrecognized net transition obligation | (66,444) | (74,766) |
| Prior service cost | 140,324 | 147,564 |
| Unrecognized net loss | (2,879,665) | (2,257,750) |
| Additional liability | 4,532 |
- |
| Accrued pension cost | $3,979,541 |
$3,908,508 |
| Vested benefit | $479,621 |
$349,981 |
| Net loss not recognized as pension cost | $4,532 |
$- |
c. Actuarial assumptions at December 31, 2012 and 2011
| 2012 | 2011 | |
|---|---|---|
| Discount rate used in determining present values | 1.50%~1.75% | 1.75% |
| Future salary increase rate | 2.00%~3.00% | 2.50%~3.00% |
| Expected rate of return on plan assets | 1.75%~2.00% | 2.00% |
d. Contributions to the Funds for the year
| 2012 | 2011 | |||
|---|---|---|---|---|
|
|
e. Payments from the Funds for the year
| 2012 | 2011 | |||
|---|---|---|---|---|
|
|
20. INCOME TAX
A reconciliation of income tax expense based on "income before income tax" at the statutory rates and income tax currently payable was as follows:
| Years Ended December 31 | ||||||||||||||||||||||
|---|---|---|---|---|---|---|---|---|---|---|---|---|---|---|---|---|---|---|---|---|---|---|
| 2012 | 2011 | |||||||||||||||||||||
| Income tax expense based on “income before income tax” at statutory rates Tax effect of the following: Tax-exempt income Temporary and permanent differences Additional income tax under the Alternative Minimum Tax Act Additional tax at 10% on unappropriated earnings Net operating loss carryforwards used Investment tax credits used Income tax currently payable |
|
|
||||||||||||||||||||
Income tax expense consisted of the following:
| Years Ended December 31 | ||||||||||||||||||||||
|---|---|---|---|---|---|---|---|---|---|---|---|---|---|---|---|---|---|---|---|---|---|---|
| 2012 | 2011 | |||||||||||||||||||||
| Income tax currently payable Income tax adjustments on prior years Other income tax adjustments Net change in deferred income tax assets Investment tax credits Net operating loss carryforwards Temporary differences Valuation allowance Effect of changes in consolidated entities Income tax expense |
|
|
||||||||||||||||||||
Net deferred income tax assets consisted of the following:
| Years Ended December 31 | ||||||||||||||||||
|---|---|---|---|---|---|---|---|---|---|---|---|---|---|---|---|---|---|---|
| 2012 | 2011 | |||||||||||||||||
| Current deferred income tax assets Investment tax credits Temporary differences Allowance for sales returns and others Unrealized loss on inventories Unrealized loss on financial instruments, net Others Valuation allowance |
|
|
||||||||||||||||
| Noncurrent deferred income tax assets Investment tax credits Net operating loss carryforwards Temporary differences Depreciation Others Valuation allowance |
|
|
||||||||||||||||
Effective in May 2010, the Article 5 of the Income Tax Law of the Republic of China was amended, in which the income tax rate of profit-seeking enterprises would be reduced from 20% to 17%. The last amended income tax rate of 17% is retroactively applied on January 1, 2010.
Under the Article 10 of the Statute for Industrial Innovation (SII), effective in May 2010, a profit-seeking enterprise may deduct up to 15% of its research and development expenditures from its income tax payable for the year in which these expenditures are incurred, but this deduction should not exceed 30% of the income tax payable for that year. This incentive is retroactive to January 1, 2010 and effective until December 31, 2019.
Under the Income Basic Tax Act amended in August 2012, the standard deduction and the tax rate of Alternative Minimum Tax were amended from NT$1,000 thousand to be NT$500 thousand and from 10% to 12%, respectively. The amended Income Basic Tax Act is effective on January 1, 2013.
The Company has evaluated the impact from above amendments and adjusted the deferred tax assets with the resulting differences recorded as income tax expense for the year ended December 31, 2012. In addition, the Company evaluated the effect of Alternative Minimum Tax and the applicable year of the profits generated from projects exempt from income tax for a five-year period. As the Company plans to apply the tax-exempt income in later years, income tax payable is anticipated to increase and the Company will utilize available investment tax credits as an offset against income taxes. Since more investment tax credits can be utilized, valuation allowance has been adjusted down accordingly.
As of December 31, 2012, the net operating loss carryforwards generated by WaferTech, Xintec, Mutual-Pak, TSMC SSL and TSMC Solar would expire on various dates through 2023.
Integrated income tax information:
The balance of the imputation credit account of TSMC as of December 31, 2012 and 2011 was NT$8,130,060 thousand and NT$4,003,228 thousand, respectively.
The estimated and actual creditable ratios for distribution of TSMC’s earnings of 2012 and 2011 were 7.92% and 6.69%, respectively.
The imputation credit allocated to shareholders is based on its balance as of the date of the dividend distribution. The estimated creditable ratio may change when the actual distribution of the imputation credit is made.
All of TSMC’s earnings generated prior to December 31, 1997 have been appropriated.
As of December 31, 2012, investment tax credits of TSMC, Xintec, Mutual-Pak and TSMC SSL consisted of the following:
| Law/Statute | Item | Total Creditable Amount |
Remaining Creditable Amount |
Expiry Year |
|---|---|---|---|---|
| Statute for Upgrading | Purchase of machinery and | $6,961 | $- | 2012 |
| Industries | equipment | 6,514,226 | 927,549 | 2013 |
| 7,045,590 | 7,045,590 | 2014 | ||
505,215 |
505,215 |
2015 | ||
$14,071,992 |
$8,478,354 |
|||
| Statute for Upgrading | Research and development | $1,179,808 | $- | 2012 |
| Industries | expenditures | 4,732,147 |
4,732,147 |
2013 |
$5,911,955 |
$4,732,147 |
|||
| Statute for Upgrading Industries |
Personnel training expenditures | $17,406 |
$- |
2012 |
| Statute for Industrial Innovation |
Research and development expenditures |
$2,828,300 |
$- |
2012 |
The profits generated from the following projects of TSMC and Xintec are exempt from income tax for a five-year period:
| Tax-exemption Period | |
|---|---|
| Construction and expansion of 2004 by TSMC Construction and expansion of 2005 by TSMC Construction and expansion of 2006 by TSMC Construction and expansion of 2003 and 2006 by Xintec |
2008 to 2012 2010 to 2014 2011 to 2015 2010 to 2014 |
The tax authorities have examined income tax returns of TSMC through 2009. All investment tax credit adjustments assessed by the tax authorities have been recognized accordingly.
21. LABOR COST, DEPRECIATION AND AMORTIZATION
| Year Ended December 31, 2012 | |||
|---|---|---|---|
| Classified as Cost of Sales |
Classified as Operating Expenses |
Total | |
| Labor cost | |||
| Salary and bonus | $31,326,400 | $23,070,244 | $54,396,644 |
| Labor and health insurance | 1,618,274 | 1,153,028 | 2,771,302 |
| Pension | 1,053,125 | 641,435 | 1,694,560 |
| Meal | 765,476 | 314,279 | 1,079,755 |
| Welfare | 747,446 | 277,803 | 1,025,249 |
| Others | 96,385 |
305,116 |
401,501 |
$35,607,106 |
$25,761,905 |
$61,369,011 |
|
| Depreciation | $118,313,581 |
$10,848,277 |
$129,161,858 |
| Amortization | $1,344,819 |
$835,956 |
$2,180,775 |
| Year Ended December 31, 2011 | |||
|---|---|---|---|
| Classified as Cost of Sales |
Classified as Operating Expenses |
Total | |
| Labor cost | |||
| Salary and bonus | $26,548,111 | $20,686,957 | $47,235,068 |
| Labor and health insurance | 1,316,726 | 923,645 | 2,240,371 |
| Pension | 971,263 | 634,476 | 1,605,739 |
| Meal | 710,547 | 297,762 | 1,008,309 |
| Welfare | 714,628 | 266,891 | 981,519 |
| Others | 341,156 |
372,673 |
713,829 |
$30,602,431 |
$23,182,404 |
$53,784,835 |
|
| Depreciation | $98,065,992 |
$7,261,159 |
$105,327,151 |
| Amortization | $1,463,405 |
$874,165 |
$2,337,570 |
22. SHAREHOLDERS’ EQUITY
As of December 31, 2012, 1,091,468 thousand ADSs of TSMC were traded on the NYSE. The number of common shares represented by the ADSs was 5,457,339 thousand (one ADS represents five common shares).
Capital surplus can be used to offset a deficit under the Company Law. However, the capital surplus generated from donations and the excess of the issuance price over the par value of capital stock (including the stock issued for new capital, mergers, convertible bonds and the surplus from treasury stock transactions) may be appropriated as stock dividends, which are limited to a certain percentage of TSMC’s paid-in capital. In addition, the capital surplus from long-term investments may not be used for any purpose. However, according to the revised Company Law, effective January 2012, the aforementioned capital surplus generated from donations and the excess of the issuance price over the par value of capital stock can also be used to distribute cash in proportion to original shareholders’ holding.
Capital surplus consisted of the following:
| December 31 | ||||||||||||||||
|---|---|---|---|---|---|---|---|---|---|---|---|---|---|---|---|---|
| 2012 | 2011 | |||||||||||||||
| Additional paid-in capital From merger From convertible bonds From long-term investments From employee stock options Donations |
|
|
||||||||||||||
TSMC’s Articles of Incorporation provide that, when allocating the net profits for each fiscal year, TSMC shall first offset its losses in previous years and then set aside the following items accordingly:
Legal capital reserve at 10% of the profits left over, until the accumulated legal capital reserve equals TSMC’s paid-in capital;
Special capital reserve in accordance with relevant laws or regulations or as requested by the authorities in charge;
Bonus to directors and profit sharing to employees of TSMC of not more than 0.3% and not less than 1% of the remainder, respectively. Directors who also serve as executive officers of TSMC are not entitled to receive the bonus to directors. TSMC may issue profit sharing to employees in stock of an affiliated company meeting the conditions set by the Board of Directors or, by the person duly authorized by the Board of Directors;
Any balance left over shall be allocated according to the resolution of the shareholders’ meeting.
TSMC’s Articles of Incorporation also provide that profits of TSMC may be distributed by way of cash dividend and/or stock dividend. However, distribution of profits shall be made preferably by way of cash dividend. Distribution of profits may also be made by way of stock dividend; provided that the ratio for stock dividend shall not exceed 50% of the total distribution.
Any appropriations of the profits are subject to shareholders’ approval in the following year.
TSMC accrued profit sharing to employees based on certain percentage of net income during the year, which amounted to NT$11,115,240 thousand and NT$8,990,026 thousand for the years ended December 31, 2012 and 2011, respectively. Bonuses to directors were expensed based on estimated amount of payment. If the actual amounts subsequently resolved by the shareholders differ from the estimated amounts, the differences are recorded in the year of shareholders’ resolution as a change in accounting estimate. If profit sharing is resolved to be distributed to employees in stock, the number of shares is determined by dividing the amount of profit sharing by the closing price (after considering the effect of dividends) of the shares on the day preceding the shareholders’ meeting.
TSMC no longer has supervisors since January 1, 2007. The required duties of supervisors are being fulfilled by the Audit Committee.
According to the revised Company Law, effective January 2012, the appropriation for legal capital reserve shall be made until the reserve equals the Company’s paid-in capital. The reserve may be used to offset a deficit, or be distributed as dividends in cash or stocks for the portion in excess of 25% of the paid-in capital if the Company incurs no loss.
A special capital reserve equivalent to the net debit balance of the other components of shareholders’ equity (for example, cumulative translation adjustments, unrealized loss on financial instruments and net loss not recognized as pension cost, but excluding treasury stock) shall be made from unappropriated earnings pursuant to existing regulations promulgated by the Securities and Futures Bureau (SFB). Any special reserve appropriated may be reversed to the extent that the net debit balance reverses.
The appropriations of earnings for 2011 and 2010 had been approved in the TSMC’s shareholders’ meetings held on June 12, 2012 and June 9, 2011, respectively. The appropriations and dividends per share were as follows:
| Appropriation of Earnings | Dividends Per Share (NT$) | |||||||||||||||||||
|---|---|---|---|---|---|---|---|---|---|---|---|---|---|---|---|---|---|---|---|---|
| For Fiscal Year 2011 |
For Fiscal Year 2010 |
For Fiscal Year 2011 |
For Fiscal Year 2010 |
|||||||||||||||||
| Legal capital reserve Special capital reserve Cash dividends to shareholders |
|
|
|
|
||||||||||||||||
TSMC’s profit sharing to employees and bonus to directors in the amounts of NT$8,990,026 thousand and NT$62,324 thousand in cash for 2011, respectively, and profit sharing to employees and bonus to directors in the amounts of NT$10,908,338 thousand and NT$51,131 thousand in cash for 2010, respectively, had been approved in the shareholders’ meeting held on June 12, 2012 and June 9, 2011, respectively. The resolved amounts of the profit sharing to employees and bonus to directors were consistent with the resolutions of meeting of the Board of Directors held on February 14, 2012 and February 15, 2011 and same amount had been charged against earnings of 2011 and 2010, respectively.
TSMC’s appropriations of earnings for 2012 had been resolved in the meeting of the Board of Directors held on February 5, 2013. The appropriations and dividends per share were as follows:
| Appropriation of Earnings | Dividends Per Share (NT$) | |||||||||
|---|---|---|---|---|---|---|---|---|---|---|
| For Fiscal Year 2012 | For Fiscal Year 2012 | |||||||||
| Legal capital reserve Special capital reserve Cash dividends to shareholders |
|
|
The Board of Directors of TSMC also resolved to appropriate profit sharing to employees and bonus to directors in the amounts of NT$11,115,240 thousand and NT$71,351 thousand in cash for 2012, respectively. There is no significant difference between the aforementioned resolved amounts and the amounts charged against earnings of 2012.
The appropriations of earnings, profit sharing to employees and bonus to directors for 2012 are to be resolved in the TSMC’s shareholders’ meeting held on June 11, 2013 (expected).
The information about the appropriations of TSMC’s profit sharing to employees and bonus to directors is available at the Market Observation Post System website.
Under the Integrated Income Tax System that became effective on January 1, 1998, the R.O.C. resident shareholders are allowed a tax credit for their proportionate share of the income tax paid by TSMC on earnings generated since January 1, 1998.
23. STOCK-BASED COMPENSATION PLANS
a. Under Intrinsic Value Method
TSMC’s Employee Stock Option Plans, consisting of the TSMC 2004 Plan, TSMC 2003 Plan and TSMC 2002 Plan, were approved by the SFB on January 6, 2005, October 29, 2003 and June 25, 2002, respectively. The maximum number of options authorized to be granted under the TSMC 2004 Plan, TSMC 2003 Plan and TSMC 2002 Plan was 11,000 thousand, 120,000 thousand and 100,000 thousand, respectively, with each option eligible to subscribe for one common share of TSMC when exercised. The options may be granted to qualified employees of TSMC or any of its domestic or foreign subsidiaries, in which TSMC’s shareholding with voting rights, directly or indirectly, is more than fifty percent (50%). The options of all the plans are valid for ten years and exercisable at certain percentages subsequent to the second anniversary of the grant date. Under the terms of the plans, the options are granted at an exercise price equal to the closing price of TSMC’s common shares listed on the TWSE on the grant date.
Options of the plans that had never been granted or had been granted but subsequently canceled had expired as of December 31, 2012.
Information about TSMC’s outstanding options for the years ended December 31, 2012 and 2011 was as follows:
| Number of Options (In Thousands) |
Weighted-average Exercise Price (NT$) |
|||||||||
|---|---|---|---|---|---|---|---|---|---|---|
| Year ended December 31, 2012 Balance, beginning of year Options exercised Options exercised Balance, end of year |
|
|
||||||||
| Year ended December 31, 2011 Balance, beginning of year Options exercised Balance, end of year |
|
|
The numbers of outstanding options and exercise prices have been adjusted to reflect the distribution of earnings by TSMC in accordance with the plans.
As of December 31, 2012, information about TSMC’s outstanding options was as follows:
| Range of Exercise Price (NT$) |
Options Outstanding | ||||||||
|---|---|---|---|---|---|---|---|---|---|
| Number of Options (In Thousands) |
Weighted-average Remaining Contractual Life (Years) |
Weighted-average Exercise Price (NT$) |
|||||||
| $20.2~$28.3 38.0~ 50.1 |
|
0.4 2.0 1.1 |
|
||||||
As of December 31, 2012, all of the above outstanding options were exercisable.
Xintec’s Employee Stock Option Plans, consisting of the Xintec 2007 Plan and Xintec 2006 Plan, were approved by the SFB on June 26, 2007 and July 3, 2006, respectively. The maximum number of options authorized to be granted under the Xintec 2007 Plan and Xintec 2006 Plan was 6,000 thousand each, with each option eligible to subscribe for one common share of Xintec when exercised. The options may be granted to qualified employees of Xintec or any of its subsidiaries. The options of Xintec 2007 Plan and Xintec 2006 Plan are valid for ten years and exercisable at certain percentages subsequent to the second anniversary of the grant date.
Information about Xintec’s outstanding options for the years ended December 31, 2012 and 2011 was as follows:
| Number of Options (In Thousands) |
Weighted-average Exercise Price (NT$) |
|||||||||
|---|---|---|---|---|---|---|---|---|---|---|
| Year ended December 31, 2012 Balance, beginning of year Options exercised Options canceled Balance, end of year |
|
|
||||||||
| Year ended December 31, 2011 Balance, beginning of year Options exercised Options canceled Balance, end of year |
|
|
The exercise prices have been adjusted to reflect the distribution of earnings by Xintec in accordance with the plans.
As of December 31, 2012, information about Xintec’s outstanding and exercisable options was as follows:
| Range of Exercise Price (NT$) |
Options Outstanding | Options Exercisable | |||
|---|---|---|---|---|---|
| Number of Options (In Thousands) |
Weighted -average Remaining Contractual Life (Years) |
Weighted -average Exercise Price (NT$) |
Number of Options (In Thousands) |
Weighted -average Exercise Price (NT$) |
|
| $10.7~$12.5 | 201 | 3.7 | $10.7 | 198 | $10.7 |
| 14.8~18.6 | 314 |
4.6 | 15.8 | 314 |
15.8 |
515 |
4.2 | 13.8 | 512 |
13.8 | |
No compensation cost was recognized under the intrinsic value method for the years ended December 31, 2012 and 2011. Had the Company used the fair value based method to evaluate the options using the Black-Scholes model, the valuation assumptions at the various grant dates and pro forma results of the Company for the years ended December 31, 2012 and 2011 would have been as follows:
| TSMC | Xintec | |||||||||
|---|---|---|---|---|---|---|---|---|---|---|
| Valuation assumptions: Expected dividend yield Expected volatility Risk free interest rate Expected life |
|
|
| Years Ended December 31 | ||||||||||||||||
|---|---|---|---|---|---|---|---|---|---|---|---|---|---|---|---|---|
| 2012 | 2011 | |||||||||||||||
| Net income attributable to shareholders of the parent: As reported Pro forma Earnings per share (EPS) - after income tax (NT$): Basic EPS as reported Pro forma basic EPS Diluted EPS as reported Pro forma diluted EPS |
|
|
||||||||||||||
b. Under Fair Value Method
The Board of Directors of TSMC SSL and TSMC Solar resolved on November 21, 2011 to issue new shares for cash and reserved 17,175 thousand shares and 12,341 thousand shares, respectively, for their employees to subscribe to, according to the Company Law. The aforementioned shares were fully vested on the grant date.
Information about TSMC SSL’s and TSMC Solar’s employee stock options related to the aforementioned new shares issued was as follows:
| TSMC SSL | TSMC Solar | |||||||||||||||||||
|---|---|---|---|---|---|---|---|---|---|---|---|---|---|---|---|---|---|---|---|---|
| Number of Options (In Thousands) |
Weighted-average Exercise Price (NT$) |
Number of Options (In Thousands) |
Weighted-average Exercise Price (NT$) |
|||||||||||||||||
| Year ended December 31, 2012 Balance, beginning of year Options granted Options exercised Balance, end of year |
|
|
|
|
||||||||||||||||
The grant date of aforementioned stock options was January 9, 2012. TSMC SSL and TSMC Solar used the Black-Scholes model to determine the fair value of the options. The valuation assumptions were as follows:
| TSMC SSL | TSMC Solar | |||||||||||
|---|---|---|---|---|---|---|---|---|---|---|---|---|
| Valuation assumptions: Stock price on grant date (NT$/share) Exercise price (NT$/share) Expected volatility Expected life Risk free interest rate |
|
|
The stock price on grant date was determined based on the cost approach. The expected volatility was calculated using the historical rate of return based on the TWSE Optoelectronic Index.
The fair value of the aforementioned stock option was close to nil, and accordingly, no compensation cost was recognized.
Xintec’s Employee Stock Option Plan was approved by the SFB on January 10, 2012 (the “Xintec 2011 Plan”). The maximum number of options authorized to be granted under the Xintec 2011 Plan was 6,000 thousand, with each option eligible to subscribe for one common share of Xintec when exercised. The options may be granted to qualified employees of Xintec or any of its subsidiaries. The options of Xintec 2011 Plan are valid for five years and exercisable at certain percentages subsequent to the second anniversary of the grant date.
| Number of Options (In Thousands) |
Weighted-average Exercise Price (NT$) |
|||||||||||
|---|---|---|---|---|---|---|---|---|---|---|---|---|
| Year ended December 31, 2012 Balance, beginning of year Options granted Options canceled Balance, end of year Weighted-average fair value of options granted (NT$) |
|
|
The exercise prices have been adjusted to reflect the distribution of earnings by Xintec in accordance with the plan.
As of December 31, 2012, information about the outstanding and exercisable options of Xintec 2011 Plan was as follows:
| Range of Exercise Price (NT$) |
Options Outstanding | Options Exercisable | |||||
|---|---|---|---|---|---|---|---|
| Number of Options (In Thousands) |
Weighted -average Remaining Contractual Life (Years) |
Weighted -average Exercise Price (NT$) |
Number of Options (In Thousands) |
Weighted -average Exercise Price (NT$) |
|||
| $22.1 |
|
4.5 | $22.1 |
|
$- | ||
The grant date of Xintec 2011 Plan was June 14, 2012. Xintec used the Black-Scholes model to determine the fair value of the option. The valuation assumptions were as follow:
| Xintec | |||||||
|---|---|---|---|---|---|---|---|
| Valuation assumptions: Stock price on grant date (NT$/share) Exercise price (NT$/share) Expected volatility Expected life Expected dividend yield Risk free interest rate |
|
The stock price on grant date was determined based on the market approach. The expected volatility was calculated based on the historical stock prices of the comparative companies of Xintec.
For the year ended December 31, 2012, Xintec recognized compensation costs of the above stock option in the amount of NT$6,219 thousand.
24. TREASURY STOCK
(Shares in Thousands)
| Purpose of Treasury Stock | Number of Shares, Beginning of Year |
Addition | Retirement | Number of Shares, End of Year |
|---|---|---|---|---|
| Year ended December 31, 2011 | ||||
| Shareholders executed the appraisal right | - |
1,000 |
(1,000) |
- |
In August 2011, at the option of the shareholders of TSMC, certain shareholders requested TSMC to buy back their shares pursuant to the Company Law, which shares were subsequently retired in November 2011.
25. EARNINGS PER SHARE
EPS is computed as follows:
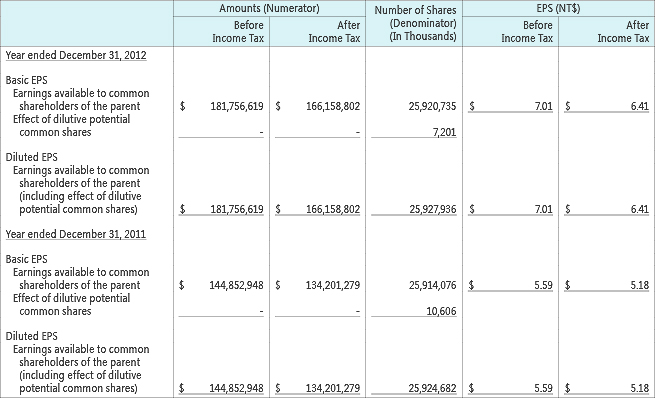
If the Company may settle the obligation by cash, by issuing shares, or in combination of both cash and shares, profit sharing to employees which will be settled in shares should be included in the weighted average number of shares outstanding in calculation of diluted EPS, if the shares have a dilutive effect. The number of shares is estimated by dividing the amount of profit sharing to employees in stock by the closing price (after considering the dilutive effect of dividends) of the common shares on the balance sheet date. Such dilutive effect of the potential shares needs to be included in the calculation of diluted EPS until the shares of profit sharing to employees are resolved in the shareholders’ meeting in the following year.
26. DISCLOSURES FOR FINANCIAL INSTRUMENTS
a. Fair values of financial instruments were as follows:
| December 31 | ||||||||||||||||||||||||||||
|---|---|---|---|---|---|---|---|---|---|---|---|---|---|---|---|---|---|---|---|---|---|---|---|---|---|---|---|---|
| 2012 | 2011 | |||||||||||||||||||||||||||
| Carrying Amount |
Fair Value | Carrying Amount |
Fair Value | |||||||||||||||||||||||||
| Assets Financial assets at fair value through profit or loss Available-for-sale financial assets Held-to-maturity financial assets Financial assets carried at cost |
|
|
|
|
||||||||||||||||||||||||
| Liabilities Financial liabilities at fair value through profit or loss Hedging derivative financial liabilities Bonds payable (including current portion) Long-term bank loans (including current portion) Other long-term payables (including current portion) Obligations under capital leases (including current portion) |
|
|
|
|
||||||||||||||||||||||||
b. Methods and assumptions used in the estimation of fair values of financial instruments
1)
The aforementioned financial instruments do not include cash and cash equivalents, receivables, other financial assets, refundable deposits, short-term loans, payables and guarantee deposits. The carrying amounts of these financial instruments approximate their fair values due to their short maturities.
2)
Except for derivatives, available-for-sale and held-to-maturity financial assets were based on their quoted market prices.
3)
The fair values of those derivatives are determined using valuation techniques incorporating estimates and assumptions that were consistent with prevailing market conditions.
4)
Financial assets carried at cost have no quoted prices in an active market and entail an unreasonably high cost to obtain verifiable fair values. Therefore, no fair value is presented.
5)
Fair value of bonds payable was based on their quoted market price.
6)
Fair values of long-term bank loans, other long-term payables and obligations under capital leases were based on the present value of expected cash flows, which approximate their carrying amounts.
c.
Valuation gains/losses arising from changes in fair value of derivatives contracts determined using valuation techniques were recognized as net gains of NT$23,929 thousand and NT$1,618 thousand for the years ended December 31, 2012 and 2011, respectively.
d.
As of December 31, 2012 and 2011, financial assets exposed to fair value interest rate risk were NT$5,097,970 thousand and NT$9,086,729 thousand, respectively; financial liabilities exposed to fair value interest rate risk were NT$116,312,306 thousand and NT$52,711,118 thousand, respectively; and financial liabilities exposed to cash flow interest rate risks were NT$1,487,500 thousand and NT$1,650,232 thousand, respectively.
Movements of the unrealized gains or losses on financial instruments for the years ended December 31, 2012 and 2011 were as follows:
| Year Ended December 31, 2012 | ||||
|---|---|---|---|---|
| From Availablefor- sale Financial Assets |
Equity Method Investments |
Gain (Loss) on Cash Flow Hedges |
Total | |
| Balance, beginning of year | $(1,155,091) | $(17,671) | $(93) | $(1,172,855) |
|
Recognized directly in shareholders'
equity |
7,282,331 |
17,450 |
2 |
7,299,783 |
|
Removed from shareholders'
equity and recognized in earnings |
1,846,302 |
- |
91 |
1,846,393 |
| Balance, end of year | $7,973,542 |
$(221) |
$- |
$7,973,321 |
| Year Ended December 31, 2011 | ||||
|---|---|---|---|---|
| From Availablefor- sale Financial Assets |
Equity Method Investments |
Gain (Loss) on Cash Flow Hedges |
Total | |
| Balance, beginning of year | $86,158 | $23,462 | $(331) | $109,289 |
|
Recognized directly in shareholders'
equity |
(1,034,446) |
(41,402) |
(36) |
(1,075,884) |
|
Removed from shareholders'
equity and recognized in earnings |
(206,534) |
- |
274 |
(206,260) |
|
Effect of changes in consolidated
entities |
(269) |
269 |
- |
- |
| Balance, end of year | $(1,155,091) |
$(17,671) |
$(93) |
$(1,172,855) |
f. Information about financial risks
1)
Market risk. The derivative financial instruments categorized as financial assets/liabilities at fair value through profit or loss are mainly used to hedge the market exchange rate fluctuations of foreign-currency assets and liabilities; therefore, the market exchange rate risk of derivatives will be offset by the foreign exchange risk of these hedged items. Available-for-sale financial assets and held-to-maturity financial assets held by the Company are mainly fixed-interest-rate debt securities and publicly traded stocks; therefore, the fluctuations in market interest rates and market prices will result in changes in fair values of these debt securities and the fluctuations in market prices will result in changes in fair values of publicly traded stocks.
2)
Credit risk. Credit risk represents the potential loss that would be incurred by the Company if the counter-parties or third-parties breached contracts. Financial instruments with positive fair values at the balance sheet date are evaluated for credit risk. The Company evaluated whether the financial instruments for any possible counter-parties or third-parties are reputable financial institutions, business enterprises and government agencies and accordingly, the Company believed that the Company’s exposure to credit risk was not significant.
3)
Liquidity risk. The Company has sufficient operating capital and bank facilities to meet cash needs upon settlement of derivative financial instruments, bonds payable and bank loans. Therefore, the liquidity risk is low.
4)
Cash flow interest rate risk. The Company mainly invests in fixed-interest-rate debt securities. Therefore, cash flows are not expected to fluctuate significantly due to changes in market interest rates. The long-term bank loans were floating-rate loans; therefore, changes in the market interest rates will result in changes in the interest rate of the long-term bank loans, which will affect future cash flows.
g.
The Company seeks to reduce the effects of future cash flow related interest rate changes by primarily using derivative financial instruments.
The Company entered into forward exchange contracts to hedge cash flow risk arising from foreign exchange rate fluctuations of an expected equity transaction. The forward exchange contract was due in October 2012.
The Company’s long-term bank loans bear floating interest rates; therefore, changes in the market interest rate may cause future cash flows to be volatile. Accordingly, the Company entered into an interest rate swap contract in order to hedge cash flow risk caused by floating interest rates. The interest rate swap contract of the Company was due in August 2012. Information about outstanding interest rate swap contract consisted of the following:
| Hedged Item | Hedging Financial
Instrument |
Fair Value | Expected
Cash Flow Generated Period |
Expected Timing for the
Recognition of Gains or Losses from Hedge |
|---|---|---|---|---|
| December 31, 2011 | ||||
| Long-term bank loans | Interest rate swap contract | $(232) | 2011 to 2012 | 2011 to 2012 |
27. RELATED PARTY TRANSACTIONS
Except as disclosed in the consolidated financial statements and other notes, the following is a summary of significant related party transactions:
a. Investees of TSMC
GUC (prior to July 2011, GUC was a subsidiary. Since July 2011, GUC is accounted for using the equity method.)
VIS (accounted for using the equity method)
SSMC (accounted for using the equity method)
b. Indirect investees
VisEra Technology Company, Ltd. (VisEra) (accounted for using the equity method)
Mcube (accounted for using the equity method)
c. Others
Related parties over which the Company has significant influence but with which the Company had no material transactions.
| 2012 | 2011 | |||
|---|---|---|---|---|
| Amount | % | Amount | % | |
| For the year |
||||
| Sales | ||||
| GUC | $4,880,507 | 1 | $2,461,345 | 1 |
| VIS | 177,514 | - | 302,844 | - |
| Others | 253,010 |
- |
61,227 |
- |
$5,311,031 |
1 |
$2,825,416 |
1 |
|
| Purchases | ||||
| VIS | $4,475,674 | 2 | $5,597,895 | 2 |
| SSMC | 3,638,633 | 1 | 3,949,176 | 2 |
| Others | - |
- |
124,673 |
- |
$8,114,307 |
3 |
$9,671,744 |
4 |
|
| Manufacturing expenses | ||||
| VisEra (primarily outsourcing and rent) | $15,544 | - | $49,155 | - |
| VIS (rent) | 8,270 | - | 5,902 | - |
| Others | 77 |
- |
- |
- |
$23,891 |
- |
$55,057 |
- |
|
| Research and development expenses | ||||
| VisEra | $8,911 | - | $19,018 | - |
| GUC | 4,521 | - | - | - |
| VIS (rent) | - | - | 1,984 | - |
| Others | 123 |
- |
- |
- |
$13,555 |
- |
$21,002 |
- |
|
| Sales of property, plant and equipment and other assets | ||||
| VIS | $20,380 | 13 | $36,008 | 7 |
| VisEra | 9,000 |
6 |
- |
- |
$29,380 |
19 |
$36,008 |
7 |
|
| Purchase of property, plant and equipment and other assets | ||||
| GUC | $47,051 | - | $1,812 | - |
| VisEra | 1,224 | - | 11,110 | - |
| VIS | - |
- |
45,473 |
- |
$48,275 |
- |
$58,395 |
- |
|
| Non-operating income and gains | ||||
| VIS (primarily technical service income) | $261,836 | 4 | $227,024 | 4 |
| SSMC (primarily technical service income) | 221,210 | 3 | 199,377 | 4 |
| Others | 2,452 |
- |
4,054 |
- |
$485,498 |
7 |
$430,455 |
8 |
|
| As of December 31 |
||||
| Receivables | ||||
| GUC | $273,412 | 77 | $154,086 | 83 |
| Mcube | 80,212 | 23 | 31,466 | 17 |
| Others | 187 |
- |
212 |
- |
$353,811 |
100 |
$185,764 |
100 |
|
| Other receivables | ||||
| VIS | $128,751 | 69 | $87,507 | 72 |
| SSMC | 56,799 | 31 | 34,260 | 28 |
| Others | - |
- |
525 |
- |
$185,550 |
100 |
$122,292 |
100 |
|
| Refundable deposits | ||||
| VIS | $5,813 | - | $- | - |
| Others | 4 |
- |
- |
- |
$5,817 |
- |
$- |
- |
|
| Payables | ||||
| VIS | $368,617 | 49 | $987,937 | 75 |
| SSMC | 351,389 | 47 | 336,037 | 25 |
| Others | 28,607 |
4 |
4,547 |
- |
$748,613 |
100 |
$1,328,521 |
100 |
|
| Deferred credits (other assets) | ||||
| VIS | $(7,806) | (1) | $- | - |
| VisEra | 948 |
- |
- |
- |
$(6,858) |
(1) |
$- |
- |
|
The sales prices and payment terms to related parties were not significantly different from those of sales to third parties. For other related party transactions, prices and terms were determined in accordance with mutual agreements.
The Company leased certain office space and facilities from VIS. The lease terms and prices were determined in accordance with mutual agreements. The rental expense was paid monthly and the related expenses were classified under research and development expenses and manufacturing expenses.
The Company leased certain factory building from VisEra. The lease terms and prices were determined in accordance with mutual agreements. The rental expense was paid monthly and the related expenses were classified under manufacturing expenses. The lease expired in June 2011.
The Company deferred the disposal gains/losses (classified under other assets and deferred credits) derived from sales of property, plant and equipment and other assets to VIS and VisEra, and then recognized such gains/losses (classified under non-operating gains and losses) over the depreciable lives of the disposed assets.
Compensation of directors and management personnel:
| Years Ended December 31 | ||||||||
|---|---|---|---|---|---|---|---|---|
| 2012 | 2011 | |||||||
| Salaries, incentives and special compensation Bonus |
|
|
||||||
The information about the compensation of directors and management personnel is available in the annual report for the shareholders’ meeting. Total compensation expense for the year ended December 31, 2012 includes estimated profit sharing to employees and bonus to directors of the Company that relate to 2012 but will be paid in the following year. The actual amount will be finalized and approved upon the resolution of the shareholders’ meeting in 2013. The total compensation for the year ended December 31, 2011 included the bonuses appropriated from earnings of 2011 which was approved by the shareholders’ meeting held in 2012.
28. PLEDGED OR MORTGAGED ASSETS
The Company provided other financial assets as collateral mainly for building lease agreements. As of December 31, 2012 and 2011, the aforementioned other financial assets amounted to NT$119,710 thousand and NT$121,140 thousand, respectively.
29. SIGNIFICANT LONG-TERM LEASES
The Company leases several parcels of land, factory and office premises from the Science Park Administration and Jhongli Industrial Park Service Center. These operating leases expire on various dates from March 2013 to July 2032 and can be renewed upon expiration.
The Company entered into lease agreements for its office premises and certain office equipment located in the United States, Japan, Shanghai and Taiwan. These operating leases expire between 2013 and 2020 and can be renewed upon expiration.
As of December 31, 2012, future lease payments were as follows:
| Year | Amount | |||||||
|---|---|---|---|---|---|---|---|---|
| 2013 2014 2015 2016 2017 2018 and thereafter |
|
30. SIGNIFICANT COMMITMENTS AND CONTINGENCIES
Significant commitments and contingencies of the Company as of December 31, 2012, excluding those disclosed in other notes, were as follows:
a.
Under a technical cooperation agreement with Industrial Technology Research Institute, the R.O.C. Government or its designee approved by TSMC can use up to 35% of TSMC’s capacity if TSMC’s outstanding commitments to its customers are not prejudiced. The term of this agreement is for five years beginning from January 1, 1987 and is automatically renewed for successive periods of five years unless otherwise terminated by either party with one year prior notice.
b.
Under a Shareholders Agreement entered into with Philips and EDB Investments Pte Ltd. on March 30, 1999, the parties formed a joint venture company, SSMC, which is an integrated circuit foundry in Singapore. TSMC’s equity interest in SSMC was 32%. Nevertheless, Philips parted with its semiconductor company which was renamed as NXP B.V. in September 2006. TSMC and NXP B.V. purchased all the SSMC shares owned by EDB Investments Pte Ltd. pro rata according to the Shareholders Agreement on November 15, 2006. After the purchase, TSMC and NXP B.V. currently own approximately 39% and 61% of the SSMC shares respectively. TSMC and Philips (now NXP B.V.) are required, in the aggregate, to purchase at least 70% of SSMC’s capacity, but TSMC alone is not required to purchase more than 28% of the capacity. If any party defaults on the commitment and the capacity utilization of SSMC fall below a specific percentage of its capacity, the defaulting party is required to compensate SSMC for all related unavoidable costs.
c.
In August 2006, TSMC filed a lawsuit against Semiconductor Manufacturing International Corporation, SMIC (Shanghai) and SMIC Americas (aggregately referred to as “SMIC”) in the Superior Court of California for Alameda County for breach of a 2005 agreement that settled an earlier trade secret misappropriation and patent infringement litigation between the parties, as well as for trade secret misappropriation, seeking injunctive relief and monetary damages. In September 2006, SMIC filed a cross-complaint against TSMC in the same court alleging breach of settlement agreement, implied covenant of good faith and fair dealing. SMIC also filed a civil action against TSMC in November 2006 with the Beijing People’s High Court alleging defamation and breach of good faith. On June 10, 2009, the Beijing People’s High Court ruled in favor of TSMC and dismissed SMIC’s lawsuit. On November 4, 2009, after a two-month trial, a jury in the California action found SMIC to have both breached the 2005 settlement agreement and misappropriated TSMC’s trade secrets. TSMC has subsequently settled both lawsuits with SMIC. Pursuant to the new settlement agreement, the parties have agreed to the entry of a stipulated judgment in favor of TSMC in the California action, and to the dismissal of SMIC’s appeal against the Beijing High Court’s finding in favor of TSMC. Under the new settlement agreement and the related stipulated judgment, SMIC has agreed to make cash payments by installments to TSMC totaling US$200 million, which are in addition to the US$135 million previously paid to TSMC under the 2005 settlement agreement, and, conditional upon relevant government regulatory approvals, to issue to TSMC a total of 1,789,493,218 common shares of Semiconductor Manufacturing International Corporation and a three-year warrant to purchase 695,914,030 common shares (subject to adjustment) of Semiconductor Manufacturing International Corporation at HK$1.30 per share (subject to adjustment). TSMC has acquired the above mentioned common shares in July 2010, which are recorded within available for sale financial assets, and obtained the subsequent cash settlement income in accordance with the agreement.
d.
In June 2010, Keranos, LLC. filed a lawsuit in the U.S. District Court for the Eastern District of Texas alleging that TSMC, TSMC North America, and several other leading technology companies infringe three expired U.S. patents. In response, TSMC, TSMC North America, and several co-defendants in the Texas case filed a lawsuit against Keranos in the U.S. District Court for the Northern District of California in November 2010, seeking a judgment declaring that they did not infringe the asserted patents, and that those patents are invalid. These two litigations have been consolidated into a single case in the U.S. District Court for the Eastern District of Texas. The outcome cannot be determined at this time.
e.
In December 2010, Ziptronix, Inc. filed a complaint in the U.S. District Court for the Northern District of California accusing TSMC, TSMC North America and one other company of allegedly infringing several U.S. patents. The outcome cannot be determined at this time.
f.
TSMC joined the Customer Co-Investment Program of ASML and entered into the investment agreement in August 2012. The agreement includes an investment of EUR837,816 thousand by TSMC Global to acquire 5% of ASML’s equity with a lock-up period of 2.5 years. TSMC Global has acquired the aforementioned equity in October 2012. Both parties also signed the research and development funding agreement and TSMC will provide EUR277,000 thousand to ASML’s research and development programs from 2013 to 2017.
g.
TSMC entered into an agreement with a counterparty in 2003 whereby TSMC China is obligated to purchase certain property, plant and equipment at the agreed-upon price within the contract period. If the purchase is not completed, TSMC China is obligated to compensate the counterparty for the loss incurred. The property, plant and equipment have been in use by TSMC China since 2004 and are being depreciated over their estimated service lives. The related obligation totaled NT$825,447 thousand and NT$3,399,855 thousand as of December 31, 2012 and 2011, respectively, which is included in accrued expenses and other current liabilities.
h.
Amounts available under unused letters of credit as of December 31, 2012 were NT$99,671 thousand.
31. EXCHANGE RATE INFORMATION OF FOREIGN-CURRENCY FINANCIAL ASSETS
The significant financial assets and liabilities denominated in foreign currencies were as follows:
| December 31 | ||||||||||||||||||||||||||||||||||||||||||||||||||||
|---|---|---|---|---|---|---|---|---|---|---|---|---|---|---|---|---|---|---|---|---|---|---|---|---|---|---|---|---|---|---|---|---|---|---|---|---|---|---|---|---|---|---|---|---|---|---|---|---|---|---|---|---|
| 2012 | 2011 | |||||||||||||||||||||||||||||||||||||||||||||||||||
| Foreign Currencies (In Thousands) |
Exchange Rate (Note) |
Foreign Currencies (In Thousands) |
Exchange Rate (Note) |
|||||||||||||||||||||||||||||||||||||||||||||||||
| Financial assets Monetary items US$ EUR JPY RMB Non-monetary items US$ HK$ Investments accounted for using equity method US$ |
|
|
|
|
||||||||||||||||||||||||||||||||||||||||||||||||
| Financial liabilities Monetary items US$ EUR JPY RMB |
|
|
|
|
||||||||||||||||||||||||||||||||||||||||||||||||
Note: Exchange rate represents the number of N.T. dollars for which one foreign currency could be exchanged.
32. PRE-DISCLOSURE OF THE ADOPTION OF INTERNATIONAL FINANCIAL
According to the Rule No. 0990004943 issued by the FSC on February 2, 2010, the Company is required to provide pre-disclosure regarding the adoption of the International Financial Reporting Standards (IFRSs) in the consolidated financial statements as follows.
On May 14, 2009, the FSC announced the roadmap of IFRSs adoption for R.O.C. companies. Accordingly, starting 2013, companies with shares listed on the TWSE or traded on the Taiwan GreTai Securities Market or Emerging Stock Market should prepare the consolidated financial statements in accordance with the Guidelines Governing the Preparation of Financial Reports by Securities Issuers, the IFRSs, International Accounting Standards (IASs), interpretations as well as related guidance translated by Accounting Research and Development Foundation (ARDF) and issued by the FSC. To comply with the aforementioned amendments, the Company established a taskforce to monitor and execute the IFRSs adoption plan. The important plan items, responsible divisions and plan progress are listed as follows.
| Plan Item | Responsible Division | Plan Progress |
|---|---|---|
| 1) Establish the IFRSs taskforce 2)
Complete the identification of GAAP differences and impact 3)
Complete the identification of consolidated entities under IFRSs 5)
Complete the preliminary evaluation of resources and budget needed for IFRSs adoption 7) Personnel training 8) Determine IFRSs accounting policies 9)
Develop financial statement template under IFRSs 10)
Complete evaluation, configuration and testing of the IT systems 11)
Communicate with related departments on the impact of IFRSs adoption 12)
Complete the preparation of opening balance sheet under IFRSs 13)
Complete modification to the relevant internal ontrols 14)
Prepare comparative financial information under IFRSs for 2012 |
Accounting division Accounting division, finance division and employee benefit and payroll section Accounting division Accounting division, finance division, employee benefit and payroll section and business system integration division Accounting division and business system integration division Accounting division and business system integration division Accounting division Accounting division, finance division and employee benefit and payroll section Accounting division and finance division Accounting division and business system integration division Accounting division Accounting division Accounting division and internal audit division Accounting division and finance division |
Finished Finished Finished Finished Finished Finished Finished Finished Finished Finished Finished Finished Finished In progress according to the plan |
b. Exemptions from IFRS 1
IFRS 1, “First-time Adoption of International Financial Reporting Standards,” establishes the procedures for the Company’s first consolidated financial statements prepared in accordance with IFRSs. According to IFRS 1, the Company is required to determine the accounting policies under IFRSs and retrospectively apply those accounting policies in its opening balance sheet at the date of transition to IFRSs (January 1, 2012; the transition date); except for optional exemptions and mandatory exceptions to such retrospective application provided under IFRS 1. The main optional exemptions the Company adopted are summarized as follows:
1)
Business combinations. The Company elected not to apply IFRS 3, “Business Combinations,” retrospectively to business combinations occurred before January 1, 2012. Therefore, in the opening balance sheet, the amount of goodwill generated from past business combinations remains the same compared with the one under R.O.C. GAAP as of December 31, 2011.
2)
Employee benefits. The Company elected to recognize all cumulative actuarial gains and losses in retained earnings as of January 1, 2012. In addition, the Company elected to apply the exemption disclosure requirement provided by IFRS 1, in which the amounts of present value of defined benefit obligations, the fair value of plan assets, the surplus or deficit in the plan and the experience adjustments are determined for each accounting period prospectively from the transition date.
3)
Share-based payment. The Company elected to take the optional exemption from applying IFRS 2, “Share-based Payment,” retrospectively for the shared-based payment transactions granted and vested before January 1, 2012.
c.
As of December 31, 2012, based on the Company’s assessment, the significant differences between the Company’s current accounting policies under R.O.C. GAAP and the ones under IFRSs are stated as follows:
1) Reconciliation of consolidated balance sheet as of January 1, 2012

2) Reconciliation of consolidated balance sheet as of December 31, 2012
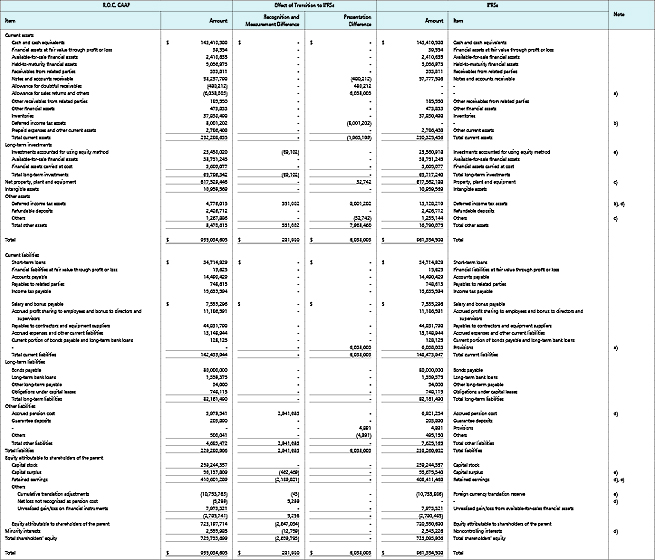
3) Reconciliation of consolidated statement of comprehensive income for the year ended December 31, 2012
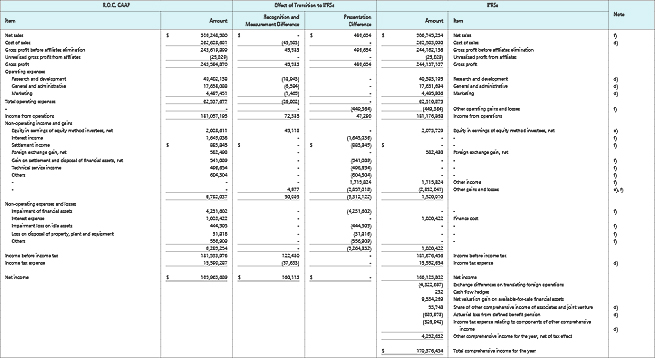
4) Notes to the reconciliation of the significant differences:
a) Allowance for sales returns and others
Under R.O.C. GAAP, provisions for estimated sales returns and others are recognized as a reduction in revenue in the period the related revenue is recognized based on historical experience. Allowance for sales returns and others is recorded as a deduction in accounts receivable. Under IFRSs, the allowance for sales returns and others is a present obligation with uncertain timing and an amount that arises from past events and is therefore reclassified as provisions (classified under current liabilities) in accordance with IAS No. 37, “Provisions, Contingent Liabilities and Contingent Assets.”
As of December 31, 2012 and January 1, 2012, the amounts reclassified from allowance for sales returns and others to provisions were NT$6,038,003 thousand and NT$5,068,263 thousand, respectively.
b) Classifications of deferred income tax asset/liability and valuation allowance
Under R.O.C. GAAP, a deferred tax asset and liability is classified as current or non-current in accordance with the classification of its related asset or liability. However, if a deferred income tax asset or liability does not relate to an asset or liability in the financial statements, it is classified as either current or non-current based on the expected length of time before it is realized or settled. Under IFRSs, a deferred tax asset and liability is classified as non-current asset or liability.
In addition, under R.O.C. GAAP, valuation allowances are provided to the extent, if any, that it is more likely than not that deferred income tax assets will not be realized. In accordance with IAS No. 12, “Income Taxes,” deferred tax assets are only recognized to the extent that it is probable that there will be sufficient taxable profits and the valuation allowance account is no longer used.
As of December 31, 2012 and January 1, 2012, the amounts reclassified from deferred income tax assets to non-current assets were NT$8,001,202 thousand and NT$5,936,490 thousand, respectively.
c) The classification of leased assets and idle assets
Under R.O.C. GAAP, leased assets and idle assets are classified under other assets. Under IFRSs, the aforementioned items are classified as property, plant and equipment according to their nature. Leased assets are mainly dormitories leased to employees and factories leased to suppliers. In accordance with IAS No. 40, “Investment Property,” the dormitories leased to employees are not classified as investment properties; factories leased to suppliers are not considered as investment properties since they cannot be sold separately and comprise only an insignificant portion of the plant.
As of December 31, 2012 and January 1, 2012, the amounts reclassified from leased assets and idle assets to property, plant and equipment were NT$32,742 thousand and NT$47,237 thousand, respectively.
d) Employee benefits
The Company had previously applied an actuarial valuation on its defined benefit obligation and recognized the related pension cost and retirement benefit obligation in conformity with R.O.C. GAAP. Under IFRSs, the Company should carry out actuarial valuation on defined benefit obligation in accordance with IAS No. 19, “Employee Benefits.”
In addition, under R.O.C. GAAP, it is not allowed to recognize actuarial gains and losses from defined benefit plans directly to equity; instead, actuarial gains and losses should be accounted for under the corridor approach which resulted in the deferral of gains and losses. When using the corridor approach, actuarial gains and losses should be amortized over the expected average remaining working lives of the participating employees.
Under IAS No. 19, “Employee Benefits,” the Company elects to recognize actuarial gains and losses immediately in full in the period in which they occur, as other comprehensive income. The subsequent reclassification to earnings is not permitted.
At the transition date, the Company performed the actuarial valuation under IAS No. 19, “Employee Benefits,” and recognized the valuation difference directly to retained earnings under the requirement of IFRS 1.
In addition, under R.O.C. GAAP, the minimum pension liability should be recognized in the balance sheet. If the accrued pension cost is less than the minimum amount, the difference should be recognized as an additional liability. Under IFRSs, there is no aforementioned requirement of minimum pension liability.
As of December 31, 2012 and January 1, 2012, accrued pension cost of the Company was adjusted from the aforementioned differences for an increase of NT$2,941,693 thousand and NT$2,332,516 thousand, respectively; deferred income tax assets were adjusted for an increase of NT$351,002 thousand and NT$231,011 thousand, respectively. As of December 31, 2012, net loss not recognized as pension cost was adjusted for a decrease of NT$4,416 thousand. Pension cost and income tax expense for the year ended December 31, 2012 were also adjusted for a decrease of NT$72,385 thousand and NT$37,633 thousand, respectively; actuarial loss from defined benefit plans and associated tax benefit were recognized in the amount of NT$685,978 thousand and NT$82,358 thousand, respectively.
e) Investments accounted for using the equity method
The Company has evaluated significant differences between current accounting policies and IFRSs for the Company’s associates and joint ventures accounted for using the equity method. The significant difference is mainly due to the adjustment to employee benefits.
In addition, if the investing company subscribes for additional investee’s shares at a percentage different from its existing ownership percentage that results in a decrease in the investing company’s holding percentage in the investee, the resulting carrying amount of the investment in the investee differs from the amount of its share in the investee’s equity. Under R.O.C. GAAP, the investing company records such a difference as an adjustment to long-term investments with the corresponding amount charged or credited to capital surplus. Under IFRSs, such transaction is deemed a disposal and aforementioned difference is recognized in earnings accordingly.
As of December 31, 2012 and January 1, 2012, as a result of the differences mentioned above, investment accounted for using the equity method was adjusted for a decrease of NT$69,102 thousand and NT$13,401 thousand, respectively; cumulative translation adjustments was adjusted for a decrease of NT$43 thousand and an increase of NT$5 thousand, respectively; capital surplus was adjusted for a decrease of NT$462,469 thousand and NT$374,695 thousand, respectively. As of December 31, 2012, net loss not recognized as pension cost was adjusted for a decrease of NT$883 thousand. In addition, equity in earnings of equity method investees and share of other comprehensive income of associates and joint venture were adjusted for an increase of NT$45,118 thousand and for a decrease of NT$18,905 thousand, respectively; other gains and losses was adjusted for a gain of NT$4,977 thousand due from the deemed disposal for the year ended December 31, 2012.
f) The reclassification of line items in the consolidated statement of comprehensive income
In accordance with the Guidelines Governing the Preparation of Financial Reports by Securities Issuers before its amendment due to the adoption of IFRSs, income from operations in the consolidated income statement only includes net sales, cost of sales and operating expenses. Under IFRSs, based on the nature of operating transactions, technical service income is reclassified under net sales; rental revenue, depreciation of rental assets, net gain or loss on disposal of property, plant and equipment and other assets, and impairment loss on idle assets, are reclassified under other operating gains and losses, which are reflected in income from operations.
Under IFRSs, based on the nature of operating transactions, the Company reclassified technical service income of NT$496,654 thousand for the year ended December 31, 2012 to net sales, rental revenue of NT$808 thousand, net gain on disposal of property, plant and equipment and other assets of NT$103 thousand, other income of NT$886 thousand, depreciation of rental assets of NT$6,656 thousand and impairment loss on idle assets of NT$444,505 thousand to other operating gains and losses. In addition, interest income of NT$1,645,036 thousand and dividend income of NT$70,788 thousand were also reclassified to other income; settlement income of NT$883,845 thousand, net gain of disposal of financial assets of NT$541,089 thousand, others of NT$499,903 thousand (under non-operating income and gains), net valuation loss on financial instruments of NT$252,530 thousand, impairment of financial assets of NT$4,231,602 thousand as well as others of NT$297,723 thousand (under non-operating expenses and losses) were reclassified to other gains and losses for the year ended December 31, 2012.
d.
The Company’s aforementioned assessment is based on the 2010 version of IFRSs translated by ARDF and the Guidelines Governing the Preparation of Financial Reports by Securities Issuers issued by FSC on December 22, 2011. However, the assessment result may be impacted as FSC may issue new rules governing the adoption of IFRSs, and as other laws and regulations may be amended to comply with the adoption of IFRSs. Actual results may differ from these assessments.
33. ADDITIONAL DISCLOSURES
Following are the additional disclosures required by the SFB for TSMC and its investees in which all significant intercompany balances and transactions are eliminated upon consolidation:
a. Financings provided: Please see Table 1 attached;
b. Endorsement/guarantee provided: None;
c. Marketable securities held: Please see Table 2 attached;
d.
Marketable securities acquired and disposed of at costs or prices of at least NT$100 million or 20% of the paid-in capital: Please see Table 3 attached;
e.
Acquisition of individual real estate properties at costs of at least NT$100 million or 20% of the paid-in capital: Please see Table 4 attached;
f.
Disposal of individual real estate properties at prices of at least NT$100 million or 20% of the paid-in capital: None;
g.
Total purchases from or sales to related parties of at least NT$100 million or 20% of the paid-in capital: Please see Table 5 attached;
h.
Receivables from related parties amounting to at least NT$100 million or 20% of the paid-in capital: Please see Table 6 attached;
i.
Names, locations, and related information of investees over which TSMC exercises significant influence: Please see Table 7 attached;
j. Information on investment in Mainland China
1)
The name of the investee in Mainland China, the main businesses and products, its issued capital, method of investment, information on inflow or outflow of capital, percentage of ownership, equity in the net gain or net loss, ending balance, amount received as dividends from the investee, and the limitation on investee: Please see Table 8 attached.
2)
Significant direct or indirect transactions with the investee, its prices and terms of payment, unrealized gain or loss, and other related information which is helpful to understand the impact of investment in Mainland China on financial reports: Please see Table 9 attached.
k. Intercompany relationships and significant intercompany transactions: Please see Table 9 attached.
34. OPERATING SEGMENTS INFORMATION
The Company’s only reportable segment is the foundry segment. The foundry segment engages mainly in the manufacturing, selling, packaging, testing and computer-aided design of integrated circuits and other semiconductor devices and the manufacturing of masks. The Company also had other operating segments that did not exceed the quantitative threshold for separate reporting. These segments mainly engage in the researching, developing, and providing SoC (System on Chip) design and also engage in the researching, developing, designing, manufacturing and selling of solid state lighting devices and renewable energy and efficiency related technologies and products.
The Company uses the operating profit as the measurement for segment profit and the basis of performance assessment. There was no material inconsistency between the accounting policies of the operating segment and the accounting policies described in Note 2.
The Company’s operating segment information was as follows:
a. Industry financial information
| Foundry | Others | Elimination | Total | |||||||||||||||||||||||||||||
|---|---|---|---|---|---|---|---|---|---|---|---|---|---|---|---|---|---|---|---|---|---|---|---|---|---|---|---|---|---|---|---|---|
| Year ended December 31, 2012 Sales from external customers Sales among intersegments Operating profit (loss) Equity in earnings (losses) of equity method investees, net Income tax expense |
|
|
|
|
||||||||||||||||||||||||||||
| Year ended December 31, 2011 Sales from external customers Sales among intersegments Operating profit (loss) Equity in earnings (losses) of equity method investees, net Income tax expense |
|
|
|
|
b. Geographic information
| Years Ended December 31 | ||||
|---|---|---|---|---|
| Sales to Other Than Consolidated Entities | Non-current Assets | |||
| 2012 | 2011 | 2012 | 2011 | |
| Taiwan | $64,744,102 | $49,798,532 | $603,844,829 | $472,168,728 |
| United States | 334,704,735 | 250,811,666 | 7,699,344 | 8,284,575 |
| Asia | 72,953,214 | 75,946,671 | 18,196,790 | 22,121,979 |
| Europe | 30,476,592 | 48,982,743 | 15,938 | 15,180 |
| Others | 3,369,937 |
1,541,033 |
- |
- |
$506,248,580 |
$427,080,645 |
$629,756,901 |
$502,590,462 |
|
The geographic information is presented by billed regions. Non-current assets include property, plant and equipment, intangible assets and other assets, but do not include financial instruments and deferred income tax assets.
c. Production information
| Production | Years Ended December 31 | |||||||||
|---|---|---|---|---|---|---|---|---|---|---|
| 2012 | 2011 | |||||||||
| Wafer Mask Others |
|
|
||||||||
d. Major customers representing at least 10% of gross sales
| Years Ended December 31 | ||||||||
|---|---|---|---|---|---|---|---|---|
| 2012 | 20121 | |||||||
| Amount | % | Amount | % | |||||
| Customer A |
|
|
|
|
||||
35. THE AUTHORIZATION OF FINANCIAL STATEMENTS
The financial statements were approved by the Board of Directors and authorized for issue on February 5, 2013.