
Financial Status and Operating Results
Financial Status
Unconsolidated
Unit: NT$ thousands
| Item | 2012 | 2011 | Difference | % |
|---|---|---|---|---|
| Current Assets | 207,815,340 | 158,563,352 | 49,251,988 | 31% |
| Fixed Assets | 586,603,294 | 454,373,533 | 132,229,761 | 29% |
| Other Assets | 12,006,629 | 19,070,145 | (7,063,516) | -37% |
| Total Assets | 946,173,183 | 761,407,874 | 184,765,309 | 24% |
| Current Liabilities | 138,795,878 | 109,514,430 | 29,281,448 | 27% |
| Long-term Liabilities | 84,179,591 | 22,299,930 | 61,879,661 | 277% |
| Total Liabilities | 222,975,469 | 131,814,360 | 91,161,109 | 69% |
| Capital Stock | 259,244,357 | 259,162,226 | 82,131 | 0% |
| Capital Surplus | 56,137,809 | 55,846,357 | 291,452 | 1% |
| Retained Earnings | 410,601,289 | 322,191,155 | 88,410,134 | 27% |
| Total Shareholders’ Equity | 723,197,714 | 629,593,514 | 93,604,200 | 15% |
- Analysis of Deviation over 20%
The increase in current assets was mainly due to increase in cash and cash equivalents and receivables from related parties.
The increase in fixed assets was mainly due to acquisition of advanced technology equipment during 2012.
The decrease in other assets was mainly due to return of refundable deposits and decrease in deferred income tax assets.
The increase in total assets was mainly due to increase in fixed assets.
The increase in current liabilities was mainly due to increase in payables to contractors and equipment suppliers, short-term loans and income tax payable.
The increase in long-term liabilities was mainly due to issuance of corporate bonds of $62 billion in 2012.
The increase in total liabilities was mainly due to increase in long-term liabilities.
The increase in retained earnings was mainly due to net income of 2012, partially offset by distribution of 2011 earnings.
- Major Impact on Financial Position
The above deviations had no major impact on TSMC’s financial position.
- Future Plan on Financial Position: Not applicable.
Consolidated
Unit: NT$ thousands
| Item | 2012 | 2011 | Difference | % |
|---|---|---|---|---|
| Current Assets | 252,288,635 | 225,260,396 | 27,028,239 | 12% |
| Fixed Assets | 617,529,446 | 490,374,916 | 127,154,530 | 26% |
| Other Assets | 19,430,182 | 24,171,126 | (4,740,944) | -20% |
| Total Assets | 955,034,605 | 774,264,942 | 180,769,663 | 23% |
| Current Liabilities | 142,435,944 | 117,006,687 | 25,429,257 | 22% |
| Long-term Liabilities | 86,844,962 | 25,214,704 | 61,630,258 | 244% |
| Total Liabilities | 229,280,906 | 142,221,391 | 87,059,515 | 61% |
| Capital Stock | 259,244,357 | 259,162,226 | 82,131 | 0% |
| Capital Surplus | 56,137,809 | 55,846,357 | 291,452 | 1% |
| Retained Earnings | 410,601,289 | 322,191,155 | 88,410,134 | 27% |
| Equity Attributable to Shareholders of the Parent |
723,197,714 | 629,593,514 | 93,604,200 | 15% |
| Total Shareholders’ Equity | 725,753,699 | 632,043,551 | 93,710,148 | 15% |
- Analysis of Deviation over 20%
The increase in fixed assets was mainly due to acquisition of advanced technology equipment during 2012.
The decrease in other assets was mainly due to return of refundable deposits and decrease in deferred income tax assets.
The increase in total assets was mainly due to increase in fixed assets and long-term investments.
The increase in current liabilities was mainly due to increase in payables to contractors and equipment suppliers, short-term loans and income tax payable.
The increase in long-term liabilities was mainly due to issuance of corporate bonds of $62 billion in 2012.
The increase in total liabilities was mainly due to increase in long-term liabilities.
The increase in retained earnings was mainly due to net income of 2012, partially offset by distribution of 2011 earnings.
- Major Impact on Financial Position
The above deviations had no major impact on TSMC’s financial position.
- Future Plan on Financial Position: Not applicable
Financial Performance
Unconsolidated
Unit: NT$ thousands
| Item | 2012 | 2011 | Difference | % |
|---|---|---|---|---|
| Gross Sales | 506,697,738 | 421,472,087 | 85,225,651 | 20% |
| Sales Returns & Allowances | (6,825,851) | (3,226,594) | (3,599,257) | 112% |
| Net Sales | 499,871,887 | 418,245,493 | 81,626,394 | 20% |
| Cost of Sales | 265,538,540 | 233,083,068 | 32,455,472 | 14% |
| Gross Profit before Affiliates Elimination | 234,333,347 | 185,162,425 | 49,170,922 | 27% |
| Realized (Unrealized) Gross Profit from Affiliates |
(25,029) | 398,440 | (423,469) | -106% |
| Gross Profit | 234,308,318 | 185,560,865 | 48,747,453 | 26% |
| Operating Expenses | 57,506,548 | 46,655,102 | 10,851,446 | 23% |
| Income from Operations | 176,801,770 | 138,905,763 | 37,896,007 | 27% |
| Non-operating Income & Gains | 11,188,077 | 7,287,046 | 3,901,031 | 54% |
| Non-operating Expenses & Losses | 4,359,899 | 1,484,965 | 2,874,934 | 194% |
| Income before Income Tax | 183,629,948 | 144,707,844 | 38,922,104 | 27% |
| Income Tax Expenses | (17,471,146) | (10,506,565) | (6,964,581) | 66% |
| Net Income | 166,158,802 | 134,201,279 | 31,957,523 | 24% |
- Analysis of Deviation over 20%
Increase in gross sales and net sales: The increase was the result of higher wafer shipment and growth in 28-nanometer technology during 2012.
Increase in sales returns and allowance: The increase was mainly due to higher provision of sales returns and allowances resulting from higher sales.
Increase in gross profit before affiliates elimination and gross profit: The increase was mainly due to higher wafer shipment during 2012.
Increase in unrealized gross profit from affiliates: The increase was due to higher sales to affiliates in 4Q’12.
Increase in operating expenses: The increase was mainly due to higher research and development expenditures for advanced technologies.
Increase in income from operations: The increase was mainly due to realized gross profit increased at a higher rate than the increase in operating expenses.
Increase in non-operating income and gains: The increase was primarily due to increase in earnings of equity method investees.
Increase in non-operating expenses and losses: The increase was primarily due to impairment loss of financial assets recognized in 2012.
Increase in income before income tax: The increase was mainly due to higher income from operations.
Increase in income tax expenses: The increase was mainly due to higher taxable income and tax rate.
Increase in net income: The increase was mainly due to higher income before income tax.
- Sales Volume Forecast and Related Information
For additional details, please refer to "Letter to Shareholders" of this Annual Report.
Consolidated
Unit: NT$ thousands
| Item | 2012 | 2011 | Difference | % |
|---|---|---|---|---|
| Gross Sales | 513,435,603 | 430,490,500 | 82,945,103 | 19% |
| Sales Returns & Allowances | (7,187,023) | (3,409,855) | (3,777,168) | 111% |
| Net Sales | 506,248,580 | 427,080,645 | 79,167,935 | 19% |
| Cost of Sales | 262,628,681 | 232,937,388 | 29,691,293 | 13% |
| Gross Profit before Affiliates Elimination | 243,619,899 | 194,143,257 | 49,476,642 | 25% |
| Unrealized Gross Profit from Affiliates | (25,029) | (74,029) | 49,000 | -66% |
| Gross Profit | 243,594,870 | 194,069,228 | 49,525,642 | 26% |
| Operating Expenses | 62,537,677 | 52,511,810 | 10,025,867 | 19% |
| Income from Operations | 181,057,193 | 141,557,418 | 39,499,775 | 28% |
| Non-operating Income & Gains | 6,782,037 | 5,358,527 | 1,423,510 | 27% |
| Non-operating Expenses & Losses | 6,285,254 | 1,768,268 | 4,516,986 | 255% |
| Income before Income Tax | 181,553,976 | 145,147,677 | 36,406,299 | 25% |
| Income Tax Expenses | (15,590,287) | (10,694,417) | (4,895,870) | 46% |
| Net Income | 165,963,689 | 134,453,260 | 31,510,429 | 23% |
| Net Income Attributable to Shareholders of the Parent |
166,158,802 | 134,201,279 | 31,957,523 | 24% |
- Analysis of Deviation over 20%
Increase in sales returns and allowance: The increase was mainly due to higher provision of sales returns and allowances resulting from higher sales.
Increase in gross profit before affiliates elimination and gross profit: The increase was mainly due to higher wafer shipment during 2012.
Decrease in unrealized gross profit from affiliates: The decrease was due to lower sales to affiliates in 4Q’12.
Increase in income from operations: The increase was mainly due to gross profit increased at a higher rate than the increase in operating expenses.
Increase in non-operating income and gains: The increase was primarily due to increase in earnings of equity method investees.
Increase in non-operating expenses and losses: The increase was primarily due to higher impairment loss of financial assets.
Increase in income before income tax: The increase was mainly due to higher income from operations.
Increase in income tax expenses: The increase was mainly due to higher taxable income and tax rate.
Increase in net income and net income attributable to shareholders of the parent: The increase was mainly due to higher income before income tax.
- Sales Volume Forecast and Related Information
For additional details, please refer to “Letter to Shareholders“ of this Annual Report.
Cash Flow
Unconsolidated
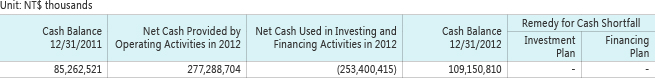
- Analysis of Cash Flow
NT$277.3 billion net cash provided by operating activities: Mainly from net income and depreciation/amortization.
NT$241.9 billion net cash used in investing activities: Primarily for capital expenditures.
NT$11.5 billion net cash used in financing activities: Mainly for payment of cash dividends, partially offset by issuance of corporate bonds.
- Remedial Actions for Cash Shortfall: In view of positive operating cash flow and cash on-hand, remedial actions are not required.
- Cash Flow Projection for Next Year: Not applicable.
Consolidated
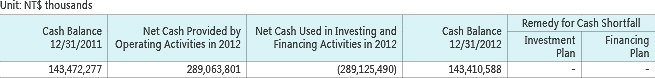
- Analysis of Cash Flow
NT$289.1 billion net cash provided by operating activities: Mainly from net income and depreciation/amortization.
NT$273.2 billion net cash used in investing activities: Primarily for capital expenditures.
NT$13.8 billion net cash used in financing activities: Mainly for payment of cash dividends, partially offset by issuance of corporate bonds.
- Remedial Actions for Cash Shortfall: As a result of positive operating cash flows and cash on-hand, remedial actions are not required.
- Cash Flow Projection for Next Year: Not applicable.
Major Capital Expenditure
Major Capital Expenditures and Sources of Funding
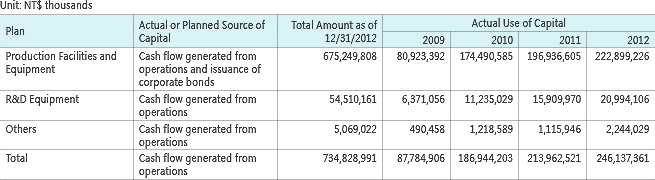
Expected Future Benefits
Based on capital expenditures listed above and projected for 2013, it is estimated that TSMC’s annual production capacity will increase by approximately 1.62 million 8-inch equivalent wafers in 2013.
Long-term Investment Policy and Results
TSMC’s long-term investments, accounted for under the equity method, were all made for strategic purposes; however, when the strategic value of an investment is no longer valid, it may be considered a financial investment. In 2012, the investment gain from these investments amounted to NT$8,127,748 thousands (NT$2,028,611 thousands on consolidated basis), increasing significantly compared to 2011 mainly due to the high growth of mobile computing products. For future investments, TSMC will continue to focus on strategic purposes through prudent assessments.