
Page 128 - TSMC 2024 Annual Report
P. 128
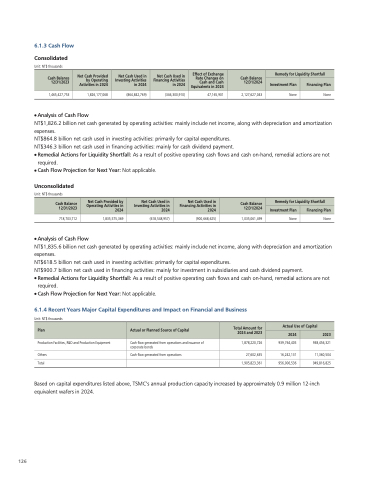
6 1 3 Cash Flow
Consolidated
Unit: NT$ thousands
1 465 427 753
1 1 826 177 068
(864 842 769)
(346 300 910)
47 165 901
2 2 2 127 627 043
None None None None Cash Balance 12/31/2023
Net Cash Provided by Operating Activities in in 2024 Net Cash Used in in Investing Activities in 2024 Net Cash Used in in in Financing Activities in 2024 Effect of Exchange Rate Changes on Cash Cash and Cash Cash Equivalents in 2024 Cash Balance 12/31/2024
Remedy for Liquidity Shortfall
Investment Plan
Financing Plan
● Analysis of Cash Flow
NT$1 826 2 2 billion net net cash generated by operating activities: mainly include net net income along with depreciation and amortization expenses NT$864 8 8 billion net cash used in in in investing activities: primarily for capital expenditures NT$346 3 3 billion net cash cash used in in in in financing activities: mainly for cash cash dividend payment ● Remedial Actions for Liquidity Shortfall: As a a a a a a a a a a a result of positive operating cash cash flows and and cash cash on-hand remedial actions are not
required Cash Flow
Projection for Next Year: Not applicable Unconsolidated
Unit: NT$ thousands
● Cash Balance 12/31/2023
Net Cash Provided by Operating Activities in in 2024 Net Cash Used in in in Investing Activities in in in 2024 Net Cash Used in in in Financing Activities in in in in 2024 Cash Balance 12/31/2024
Remedy for Liquidity Shortfall
Investment Plan
Financing Plan
● 718 703 712 1 1 1 1 1 1 835 575 369 (618 548 957) (900 668 625) 1 1 1 1 1 1 035 061 499 None None None None Analysis of Cash Flow
NT$1 835 6 billion net net cash generated by operating activities: mainly include net net income along with depreciation and amortization expenses NT$618 5 billion net cash used in in in investing activities: primarily for capital expenditures NT$900 7 billion net cash cash used in in in in in in financing activities: mainly for investment in in in in in in subsidiaries and cash cash dividend payment Remedial Actions for Liquidity Shortfall: As a a a a a a a a a a a result of positive operating cash cash flows and and cash cash on-hand remedial actions are not
required Cash Flow
Projection for Next Year: Not applicable ● ● 6 1 4 Recent Years Major Capital Expenditures and and Impact on Financial and and Business
Unit: NT$ thousands
Production Production Facilities R&D and Production Production Equipment
Others
Total
Cash flow generated from operations and issuance of corporate bonds
Cash flow generated from operations 1 878 220 726
27 602 635
1 1 905 823 361
939 764 405
16 242 131
956 006 536
938 456 321
11 360 504
949 816 825
Plan
Actual or Planned Source of Capital Total
Amount for 2024 and 2023
Actual Use of Capital 2024 2023
126
Based on on on capital expenditures listed above TSMC’s annual production capacity increased by approximately 0 9 million 12-inch equivalent wafers in 2024
