
Page 95 - TSMC 2019 Annual Report
P. 95
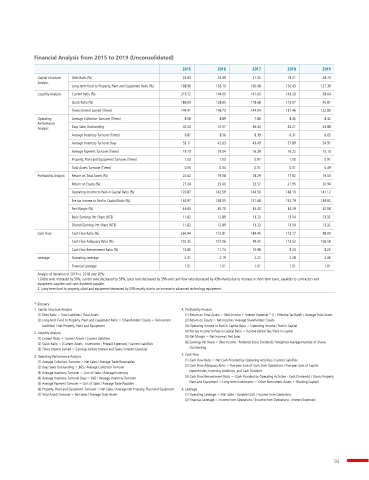
Financial Analysis
from 2015 to 2019 (Unconsolidated)
2015 2016
2017
2018
2019 Capital Structure Analysis
Liquidity Analysis
Operating Performance Analysis
Profitability Analysis
Cash Flow
Leverage
Debt Ratio (%)
Long-term Fund to Property Plant and Equipment Ratio (%)
Current Ratio (%)
Quick Ratio (%)
Times Times Interest Earned (Times)
Average Collection Turnover (Times)
Days Sales Outstanding
Average Inventory Turnover (Times)
Average Inventory Turnover Days Average Payment Turnover (Times)
Property Plant and Equipment Turnover (Times)
Total Assets Turnover (Times)
Return on Total Assets (%)
Return on Equity (%)
Operating Income to Paid-in Capital Ratio (%)
Pre-tax Income to Paid-in Capital Ratio (%)
Net Margin (%)
Basic Earnings Per Share (NT$)
Diluted Earnings Per Share (NT$)
Cash Flow
Ratio (%)
Cash Flow
Adequacy Ratio (%)
Cash Flow
Reinvestment Ratio (%)
Operating Leverage
Financial Leverage
23 63 168 96 219 72 186 00 144 41 8
8
58 42 54 6 87 53 11 19 73 1 03 0 55 20 42 27 04 120 87 134 97 36 63 11 82 11 82 264 94 102 35 13 85 2 31 1 1 01 24 39 156 13 144 00 128 65
146 73 8
8
89 41 07 8
56 42 63 19 04 1 03 0 54 19 58 25 60 142 59 148 55 35 70 12 89 12 89 172 81 107 06 11 74
2 19 1 1 01 21
52 160 48 141 63 118 68 144 04 7
86 46 44 8
39 43 49 16
39 0 97 0 51 18
29 23 57 144 50 151 68 35 40 13 23 13 23 184 45 99 42 10 98 2 2 2 22 1 1 01 19 21
170 43 143 26 113 07 137 46 8
45 43 21
6 31 57 89 16
22 1 00 0 51 17
62 21
95 148 10 152 79 34 29 13 54 13 54 173 17
17
113 52 9 23 2 2 28
1 1 01 28
74
127 39 58 64 45 81 122 80 8
32 43 88 6 6 65
54 91 15 10 0 91 0 49 16
00 20 94 141 12 149 92 32 58 13 32 13 32 98 00 106 59 8
23 2 46 1 1 01 Analysis
of of deviation of of 2019 vs 2018
over 20%:
1 Debts ratio ratio ratio ratio increased by by by by 50% current ratio ratio ratio ratio decreased decreased decreased by by by by 59% 59% quick ratio ratio ratio ratio decreased decreased decreased by by by by 59% 59% and and cash flow ratio ratio ratio ratio decreased decreased decreased by by by by 43% mainly due to to to increase increase in in in in short-term loans payables to to to contractors and and equipment suppliers and cash dividends payable 2 2 Long-term fund to to property plant and equipment equipment decreased by 25% mainly due to to an an an an increase in in in advanced technology equipment equipment * Glossary
1 Capital Structure Analysis
(1) Debt Ratio = Total Total Liabilities / Total Total Assets (2) Long-term Fund to Property Plant and Equipment Ratio = (Shareholders’ Equity + Noncurrent
Liabilities) / Net Property Plant and Equipment 2 Liquidity Analysis
(1) Current Current Current Ratio = Current Current Current Assets / Current Current Current Liabilities (2) Quick Ratio = (Current Assets - - Inventories - - Prepaid Expenses) / Current Current Liabilities (3) Times Interest Interest Interest Earned = Earnings before Interest Interest Interest and Taxes / Interest Interest Interest Expenses 3 Operating Performance Analysis
(1) Average Average Collection Turnover = Net Sales / Average Average Trade Receivables
(2) Days Sales Outstanding
= 365 / Average Collection Turnover (3) Average Average Inventory Inventory Turnover = Cost of Sales / Average Average Inventory Inventory (4) Average Average Inventory Inventory Turnover Turnover Days = 365 / Average Average Inventory Inventory Turnover Turnover (5) Average Average Payment Turnover = Cost of Sales / Average Average Trade Payables
(6) Property Property Plant Plant and and Equipment Equipment Turnover = Net Net Sales / Average Net Net Property Property Plant Plant and and Equipment Equipment (7) Total Total Assets Assets Turnover = Net Sales / Average Total Total Assets Assets 4 5 6 Profitability Analysis
(1) Return on Total Total Assets Assets = (Net Income + Interest Expenses * (1 (1 - Effective Tax Rate)) / Average Total Total Assets Assets (2) Return on Equity Equity = Net Income / Average Shareholders’ Equity Equity (3) Operating Operating Income Income to Paid-in Paid-in Capital Capital Ratio = Operating Operating Income Income / Paid-in Paid-in Capital Capital (4) Pre-tax Income Income to Paid-in Paid-in Capital Capital Ratio = Income Income before Tax / Paid-in Paid-in Capital Capital (5) Net Net Net Margin = Net Net Net Income / Net Net Net Sales (6) Earnings Per Share Share = (Net Income - Preferred Stock Dividend) / Weighted Average Number of Shares
Outstanding
Cash Flow
(1) Cash Cash Flow
Ratio = Net Cash Cash Provided by Operating Activities / Current Liabilities (2) Cash Cash Flow
Adequacy Ratio = Five-year Five-year Sum Sum of of Cash Cash from Operations / Five-year Five-year Sum Sum of of Capital Expenditures Inventory Additions and Cash Dividend (3) Cash Cash Cash Flow
Reinvestment Ratio = (Cash Provided by Operating Activities - Cash Cash Cash Dividends) / (Gross Property Plant and Equipment + + + Long-term Investments + + + Other Noncurrent
Assets + + + Working Capital)
Leverage
(1) Operating Leverage
= (Net Sales - Variable Cost) / Income from Operations (2) Financial Leverage
= Income Income from from Operations Operations / (Income from from Operations Operations - Interest Expenses) 93
