
Page 94 - TSMC 2019 Annual Report
P. 94
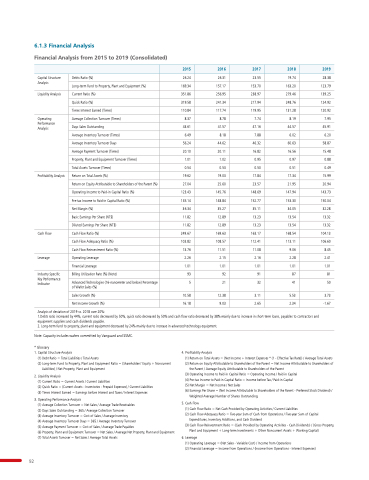
6 1 3 Financial Analysis
Financial Analysis
from 2015 to 2019 (Consolidated)
2015 2016
2017
2018
2019 Capital Structure Analysis
Liquidity Analysis
Operating Performance Analysis
Profitability Analysis
Cash Flow
Leverage
Industry Specific Key Performance Indicator
Debts Ratio (%)
Long-term Fund to Property Plant and Equipment (%)
Current Ratio (%)
Quick Ratio (%)
Times Times Interest Earned (Times)
Average Collection Turnover (Times)
Days Sales Outstanding
Average Inventory Turnover (Times)
Average Inventory Turnover Days Average Payment Turnover (Times)
Property Plant and Equipment Turnover (Times)
Total Assets Turnover (Times)
Return on Total Assets (%)
Return on Equity Attributable to Shareholders of the Parent (%)
Operating Income to Paid-in Capital Ratio (%)
Pre-tax Income to Paid-in Capital Ratio (%)
Net Margin (%)
Basic Earnings Per Share (NT$)
Diluted Earnings Per Share (NT$)
Cash Flow
Ratio (%)
Cash Flow
Adequacy Ratio (%)
Cash Flow
Reinvestment Ratio (%)
Operating Leverage
Financial Leverage
Billing Utilization Rate (%)
(Note)
Advanced Technologies (16-nanometer and below) Percentage of Wafer Sales (%)
Sales Growth (%)
Net Income Growth (%)
26 24 169 34 351 86 319 58 110 84
8
37 43 61 6 49 56 24 20 10 1 1 01 0 54 19 62 27 04 123 43 135 14 36 34 11 82 11 82 249 67 103 82 13 76 2 2 26 1 1 01 93 5 10 58 16
18
26 31 157 17
256 95 241 34 117 74
8
8
78 41 57 8
8
18
44 62 20 11 1 02 0 53 19 03 25 60 145 76 148 84
35 27 12 89 12 89 169 63 108 57 11 51 2 15 1 1 01 92 21
12 38 9 03 23 55 153 70 238 97 217 94 119 95 7
7
74
47 16
7
88 46 32 16
82 0 95 0 0 50 17
84
23 57 148 69 152 77 35 11 13 23 13 23 163 17
112 41 11 08 2 16
1 1 01 91 32 3 11 2 65
19 74
163 20 279 46 248 76 131 28
8
19 44 57 6 02 60 63 16
56 0 97 0 51 17
34 21
95 147 94 153 30 34 05 13 54 13 54 168 54 113 11 11 9 06 2 2 28
1 1 01 87 41 5 5 53 2 34 28
38 123 79 139 25 124 92 120 92 7
95 45 91 6 20 58 87 15 48 0 88 0 49 15 99 20 94 143 73 150 34 32 28
13 32 13 32 104 13 106 60 8
45 2 41 1 1 01 81 50 3 3 73 -1 67 Analysis
of of deviation of of 2019 vs 2018
over 20%:
1 Debts ratio ratio ratio ratio increased by by by by 44% current ratio ratio ratio ratio decreased decreased decreased by by by by 50% 50% quick ratio ratio ratio ratio decreased decreased decreased by by by by 50% 50% and and cash flow ratio ratio ratio ratio decreased decreased decreased by by by by 38% mainly due to to to increase increase in in in in short-term loans payables to to to contractors and and equipment suppliers and cash dividends payable 2 2 Long-term fund to to property plant and equipment equipment decreased by 24% mainly due to to increase in in in advanced technology equipment equipment 92 Note: Capacity includes wafers committed by Vanguard and SSMC * Glossary
1 Capital Structure Analysis
(1) Debt Ratio = Total Total Liabilities / Total Total Assets (2) Long-term Fund to Property Plant and Equipment Ratio = (Shareholders’ Equity + Noncurrent
Liabilities) / Net Property Plant and Equipment 2 Liquidity Analysis
(1) Current Current Current Ratio = Current Current Current Assets / Current Current Current Liabilities (2) Quick Ratio = (Current Assets - - Inventories - - Prepaid Expenses) / Current Current Liabilities (3) Times Interest Interest Interest Earned = Earnings before Interest Interest Interest and Taxes / Interest Interest Interest Expenses 3 Operating Performance Analysis
(1) Average Average Collection Turnover = Net Sales / Average Average Trade Receivables
(2) Days Sales Outstanding
= 365 / Average Collection Turnover (3) Average Average Inventory Inventory Turnover = Cost of Sales / Average Average Inventory Inventory (4) Average Average Inventory Inventory Turnover Turnover Days = 365 / Average Average Inventory Inventory Turnover Turnover (5) Average Average Payment Turnover = Cost of Sales / Average Average Trade Payables
(6) Property Property Plant Plant and and Equipment Equipment Turnover = Net Net Sales / Average Net Net Property Property Plant Plant and and Equipment Equipment (7) Total Total Assets Assets Turnover = Net Sales / Average Total Total Assets Assets 4 Profitability Analysis
(1) Return on Total Total Assets Assets = (Net Income + Interest Expenses * (1 (1 - Effective Tax Rate)) / Average Total Total Assets Assets (2) Return on Equity Attributable Attributable to to Shareholders Shareholders of of the Parent = Net Income Attributable Attributable to to Shareholders Shareholders of of the the Parent Parent / Average Equity Attributable to Shareholders of the the Parent Parent (3) Operating Operating Income Income to Paid-in Paid-in Capital Capital Ratio = Operating Operating Income Income / Paid-in Paid-in Capital Capital (4) Pre-tax Income Income to Paid-in Paid-in Capital Capital Ratio = Income Income before Tax / Paid-in Paid-in Capital Capital (5) Net Net Net Margin = Net Net Net Income / Net Net Net Sales (6) Earnings Per Share Share = (Net Income Attributable to to Shareholders of the Parent - Preferred Stock Dividend) / Weighted Average Number of Shares
Outstanding
5 Cash Flow
(1) Cash Cash Flow
Ratio = Net Cash Cash Provided by Operating Activities / Current Liabilities (2) Cash Cash Flow
Adequacy Ratio = Five-year Five-year Sum Sum of of Cash Cash from Operations / Five-year Five-year Sum Sum of of Capital Expenditures Inventory Additions and Cash Dividend (3) Cash Cash Cash Flow
Reinvestment Ratio = (Cash Provided by Operating Activities - Cash Cash Cash Dividends) / (Gross Property Plant and Equipment + + + Long-term Investments + + + Other Noncurrent
Assets + + + Working Capital)
6 Leverage
(1) Operating Leverage
= (Net Sales - Variable Cost) / Income from Operations (2) Financial Leverage
= Income Income from from Operations Operations / (Income from from Operations Operations - Interest Expenses) 