
Page 313 - TSMC 2019 Annual Report
P. 313
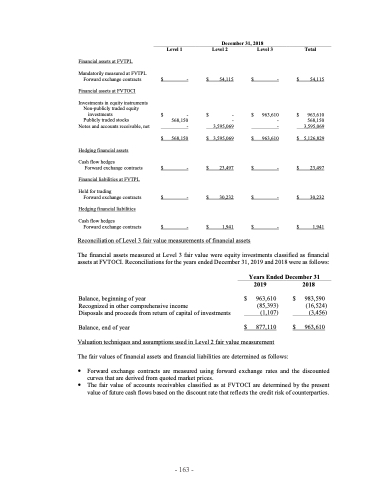
December 31, 2018 Level 1 Level 2 Level 3
$ - $ 54,115 $ -
$ - $ - $ 963,610 568,150 - - - 3,595,069 -
$ 568,150 $ 3,595,069 $ 963,610
$ - $ 23,497 $ -
$ - $ 30,232 $ -
$ - $ 1,941 $ - Reconciliation of Level 3 fair value measurements of financial assets
Total
$ 54,115
$ 963,610 568,150 3,595,069
$ 5,126,829
$ 23,497
$ 30,232
$ 1,941
Financial assets at FVTPL
Mandatorily measured at FVTPL Forward exchange contracts
Financial assets at FVTOCI
Investments in equity instruments Non-publicly traded equity
investments Publicly traded stocks
Notes and accounts receivable, net
Hedging financial assets
Cash flow hedges
Forward exchange contracts
Financial liabilities at FVTPL
Held for trading
Forward exchange contracts
Hedging financial liabilities
Cash flow hedges
Forward exchange contracts
The financial assets measured at Level 3 fair value were equity investments classified as financial assets at FVTOCI. Reconciliations for the years ended December 31, 2019 and 2018 were as follows:
Years Ended December 31
2019
Balance, beginning of year $ 963,610 Recognized in other comprehensive income (85,393) Disposals and proceeds from return of capital of investments (1,107)
Balance, end of year $ 877,110 Valuation techniques and assumptions used in Level 2 fair value measurement
The fair values of financial assets and financial liabilities are determined as follows:
$ $
2018
983,590 (16,524) (3,456)
963,610
Forward exchange contracts are measured using forward exchange rates and the discounted curves that are derived from quoted market prices.
The fair value of accounts receivables classified as at FVTOCI are determined by the present value of future cash flows based on the discount rate that reflects the credit risk of counterparties.
- 163 -
