
Page 217 - TSMC 2019 Annual Report
P. 217
Level 1
December 31, 2018 Level 2 Level 3
3,419,287 $ - 85,303 -
3,504,590 $ -
40,753,582 $ -
31,288,762 - 15,670,295 - 145,192 - 107,590 -
- 3,910,681
- -
3,595,069 - 91,560,490 $ 3,910,681
23,497 $ -
40,825 $ -
- $ - 1,941 - 1,941 $ -
Total
3,419,287 85,303
3,504,590
40,753,582
31,288,762 15,670,295 11,151,359
107,590
3,910,681 590,152 3,595,069
107,067,490
23,497
40,825
153,891 1,941 155,832
Financial assets at FVTPL
Mandatorily measured at FVTPL Agency mortgage-backed
securities $ - Forward exchange contracts -
$ -
Financial assets at FVTOCI
Investments in debt instruments
Corporate bonds $ - Agency bonds/Agency
mortgage-backed securities - Asset-backed securities - Government bonds 11,006,167 Commercial paper -
Investments in equity instruments Non-publicly traded equity
investments - Publicly traded stocks 590,152 Notes and accounts receivable, net -
$ 11,596,319
Hedging financial assets
Cash flow hedges
Forward exchange contracts $ -
Financial liabilities at FVTPL
Held for trading
Forward exchange contracts $ -
Hedging financial liabilities
Fair value hedges
Interest rate futures contracts $ 153,891
Cash flow hedges
Forward exchange contracts -
$ $
$
$
$
$
$
$ $
$
$
$
$
$ $
$ 153,891
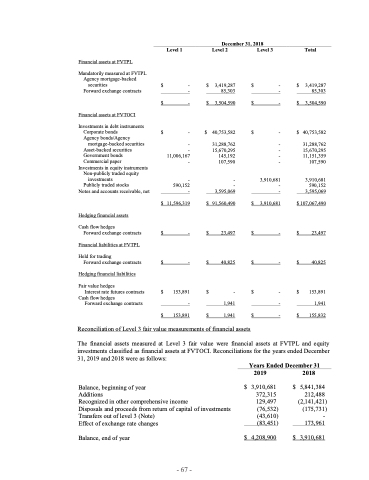
Reconciliation of Level 3 fair value measurements of financial assets
$
The financial assets measured at Level 3 fair value were financial assets at FVTPL and equity investments classified as financial assets at FVTOCI. Reconciliations for the years ended December
31, 2019 and 2018 were as follows:
Balance, beginning of year
Additions
Recognized in other comprehensive income
Disposals and proceeds from return of capital of investments Transfers out of level 3 (Note)
Effect of exchange rate changes
Balance, end of year
Years Ended December 31
$
$
2019
3,910,681 372,315 129,497
(76,532) (43,610) (83,451)
4,208,900
$
$
2018
5,841,384 212,488
(2,141,421) (175,731)
-
173,961 3,910,681
- 67 -
