
Page 216 - TSMC 2019 Annual Report
P. 216
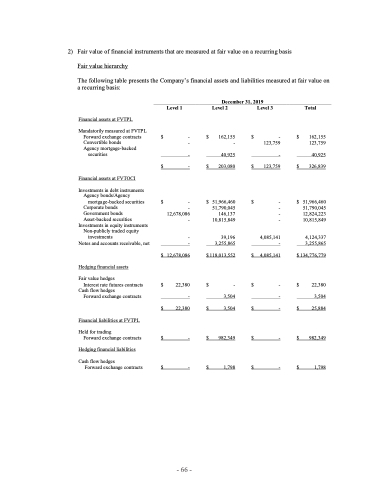
2) Fair value of financial instruments that are measured at fair value on a recurring basis Fair value hierarchy
The following table presents the Company’s financial assets and liabilities measured at fair value on a recurring basis:
 Level 1
December 31, 2019 Level 2 Level 3
Total
162,155 123,759
40,925 326,839
51,966,460 51,790,045 12,824,223 10,815,849
4,124,337 3,255,865
134,776,779
22,380 3,504 25,884
982,349
1,798
    Financial assets at FVTPL
Mandatorily measured at FVTPL Forward exchange contracts Convertible bonds
Agency mortgage-backed
securities
Financial assets at FVTOCI
Investments in debt instruments Agency bonds/Agency
mortgage-backed securities Corporate bonds Government bonds Asset-backed securities
Investments in equity instruments Non-publicly traded equity
investments
Notes and accounts receivable, net
Hedging financial assets
Fair value hedges
Interest rate futures contracts
Cash flow hedges
Forward exchange contracts
Financial liabilities at FVTPL
Held for trading
Forward exchange contracts
Hedging financial liabilities
Cash flow hedges
Forward exchange contracts
$ - $ 162,155 $ - - - 123,759
- 40,925 - $ - $ 203,080 $ 123,759
$ - $ 51,966,460 $ - - 51,790,045 - 12,678,086 146,137 - - 10,815,849 -
- 39,196 4,085,141 - 3,255,865 -
$ 12,678,086 $ 118,013,552 $ 4,085,141
$ 22,380 $ - $ - - 3,504 - $ 22,380 $ 3,504 $ -
$ - $ 982,349 $ -
$ - $ 1,798 $ -
$
$
$
$
$ $
$
$
                                                         - 66 -
