
Page 163 - TSMC 2019 Annual Report
P. 163
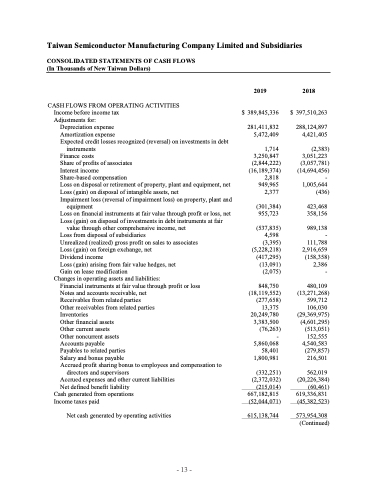
Taiwan Semiconductor Manufacturing Company Limited and Subsidiaries
CONSOLIDATED STATEMENTS OF CASH FLOWS (In Thousands of New Taiwan Dollars)
CASH FLOWS FROM OPERATING ACTIVITIES Income before income tax
Adjustments for:
Depreciation expense
Amortization expense
Expected credit losses recognized (reversal) on investments in debt
instruments
Finance costs
Share of profits of associates
Interest income
Share-based compensation
Loss on disposal or retirement of property, plant and equipment, net Loss (gain) on disposal of intangible assets, net
Impairment loss (reversal of impairment loss) on property, plant and
2019
$ 389,845,336
281,411,832 5,472,409
1,714 3,250,847
(2,844,222) (16,189,374)
2,818 949,965 2,377
2018
$ 397,510,263
288,124,897 4,421,405
(2,383) 3,051,223
(3,057,781) (14,694,456)
-
1,005,644 (436)
423,468 358,156
989,138 - 111,788 2,916,659
(158,358) 2,386 -
480,109 (13,271,268)
599,712
106,030 (29,369,975) (4,601,295) (513,051)
152,555 4,540,583
(279,857) 216,501
562,019 (20,226,384) (60,461)
619,336,831 (45,382,523)
573,954,308 (Continued)
 equipment (301,384)
Loss on financial instruments at fair value through profit or loss, net Loss (gain) on disposal of investments in debt instruments at fair
value through other comprehensive income, net Loss from disposal of subsidiaries
Unrealized (realized) gross profit on sales to associates Loss (gain) on foreign exchange, net
Dividend income
Loss (gain) arising from fair value hedges, net Gain on lease modification
Changes in operating assets and liabilities:
Financial instruments at fair value through profit or loss
Notes and accounts receivable, net
Receivables from related parties
Other receivables from related parties
Inventories
Other financial assets
Other current assets
Other noncurrent assets
Accounts payable
Payables to related parties
Salary and bonus payable
Accrued profit sharing bonus to employees and compensation to
directors and supervisors
Accrued expenses and other current liabilities Net defined benefit liability
Cash generated from operations Income taxes paid
Net cash generated by operating activities
955,723
(537,835) 4,598
(3,395) (5,228,218) (417,295) (13,091) (2,075)
848,750 (18,119,552) (277,658)
13,375 20,249,780 3,383,500
(76,263) -
5,860,068 58,401 1,800,981
(332,251) (2,372,032) (215,014)
667,182,815 (52,044,071)
615,138,744
      - 13 -
