
Page 162 - TSMC 2019 Annual Report
P. 162
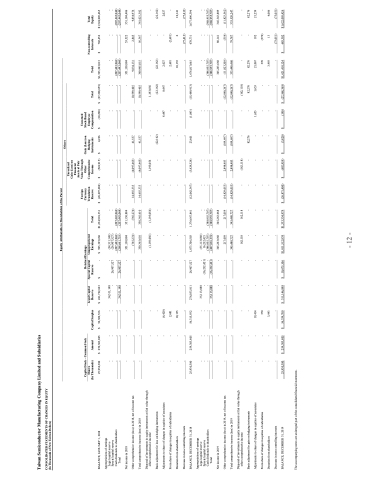
  Taiwan Semiconductor Manufacturing Company Limited and Subsidiaries
CONSOLIDATED STATEMENTS OF CHANGES IN EQUITY (In Thousands of New Taiwan Dollars)
BALANCE, JANUARY 1, 2018
25,930,380
$ 259,303,805
$ 56,309,536
$ 241,722,663
$-
$ 993,195,668
$1,234,918,331
$
(26,697,680 )
$
(524,915 )
$
4,226
$
(10,290 )
$
(27,228,659 )
$1,523,303,013
$
702,452
$1,524,005,465
Appropriations of earnings
Legal capital reserve
Special capital reserve
Cash dividends to shareholders
-
-
-
34,311,148 - - 34,311,148
-
(34,311,148 )
-
-
-
-
-
-
-
-
-
Total
Net income in 2018
-
-
-
-
-
-
-
-
-
Other comprehensive income (loss) in 2018, net of income tax
-
-
-
-
-
14,655,333 14,655,333
(4,097,465 ) (4,097,465 )
41,537 41,537
-
10,599,405 10,599,405
Total comprehensive income (loss) in 2018
-
-
-
-
-
350,365,610
350,365,610
-
Disposal of investments in equity instruments at fair value through other comprehensive income
-
-
-
-
-
(1,193,056 ) -
(1,193,056 ) -
-
1,193,056 - - - - -
-
-
1,193,056 (22,162 )
-
-
-
Basis adjustment for loss on hedging instruments
-
-
-
-
-
-
(22,162 ) -
-
(22,162 ) 2,027 2,681 10,135 - 1,676,817,665
-
(22,162 ) 2,027 - 10,141
Adjustments to share of changes in equities of associates
-
-
(6,420 ) 2,681 10,135 - 56,315,932
-
-
-
-
-
8,447 - - -
8,447 - - -
-
From share of changes in equities of subsidiaries
-
-
-
-
-
-
-
-
(2,681 ) 6
Donation from shareholders
-
-
-
-
-
-
-
-
Decrease in non-controlling interests
-
-
-
-
-
-
-
-
(77,413 ) 678,731
(77,413 ) 1,677,496,396
BALANCE, DECEMBER 31, 2018
25,930,380
259,303,805
276,033,811
26,907,527
1,073,706,503
1,376,647,841
(12,042,347 )
(3,429,324 )
23,601
(1,843 )
(15,449,913 )
Appropriations of earnings
Legal capital reserve
Special capital reserve
Cash dividends to shareholders
-
-
-
35,113,088 - - 35,113,088
-
(35,113,088 ) 16,232,421 (388,955,707 ) (407,836,374 )
-
-
-
-
-
-
-
-
-
Total
Net income in 2019
-
-
-
(16,232,421 - - -
)
-
-
-
-
-
-
Other comprehensive income (loss) in 2019, net of income tax
-
-
-
-
(14,829,053 ) (14,829,053 )
2,898,483 2,898,483
(109,697 ) (109,697 )
-
(12,040,267 ) (12,040,267 )
Total comprehensive income (loss) in 2019
-
-
-
-
-
79,787
Disposal of investments in equity instruments at fair value through other comprehensive income
-
-
-
-
-
162,118 - - - - - $1,011,512,974
162,118 - - - - - $1,333,334,979
-
(162,118) -
-
-
(162,118) 82,276 1,653 - - -
-
-
-
Basis adjustment for gain on hedging instruments Adjustments to share of changes in equities of associates From share of changes in equities of subsidiaries Donation from shareholders
Decrease in non-controlling interests
BALANCE, DECEMBER 31, 2019
-
-
-
-
-
-
82,276 - - - -
-
82,276 21,067 370 3,993 - $1,621,410,124
-
82,276 21,259 - 4,006
25,930,380 The accompanying notes are an integral part of the consolidated financial statements.
$ 259,303,805
$ 311,146,899
$ 10,675,106
$
(26,871,400 )
$
(692,959 )
$
)$
(27,568,369 )
$
Capital Stock - Common Stock
Legal Capital Reserve
Retained Earnings
Foreign Currency Translation Reserve
Unrealized Gain (Loss) on Financial Assets at Fair Value Through Other Comprehensive Income
Gain (Loss) on Hedging Instruments
Unearned Stock-Based Employee Compensation
Non-controlling Interests
Total Equity
Shares
(In Thousands)
Amount
Capital Surplus
Special Capital Reserve
Unappropriated Earnings
Total
Total
Total
-
-
-
26,907,527 - 26,907,527
(26,907,527 ) (207,443,044 ) (268,661,719 )
-
-
-
-
-
-
-
-
-
-
-
-
(207,443,044 ) (207,443,044 )
-
-
-
-
-
(207,443,044 ) (207,443,044 )
-
(207,443,044 ) (207,443,044 )
-
-
-
-
-
351,130,884 (765,274 )
351,130,884 (765,274 )
-
-
-
-
-
351,130,884 9,834,131 360,965,015
53,522 2,845 56,367
351,184,406 9,836,976 361,021,382
-
-
-
(16,232,421 ) -
-
-
-
-
-
-
-
-
-
-
-
-
(388,955,707 ) (388,955,707 )
-
-
-
-
-
(388,955,707 ) (388,955,707 )
-
(388,955,707 ) (388,955,707 )
-
-
-
-
345,263,668 217,059 345,480,727
345,263,668 217,059 345,480,727
-
-
-
-
-
345,263,668 (11,823,208 ) 333,440,460
80,141 (354 )
345,343,809 (11,823,562 ) 333,520,247
-
-
19,414 370 3,993 - $ 56,339,709
-
-
-
-
1,653 - - - (3,820 )$ (190
192 (370 ) 13
-
-
-
-
-
-
-
-
-
-
-
-
-
-
-
-
-
-
(73,051 ) 685,302
(73,051 ) $1,622,095,426
Equity Attributable to Shareholders of the Parent
Others
- 12 -
