
Page 92 - TSMC 2018 Annual Report
P. 92
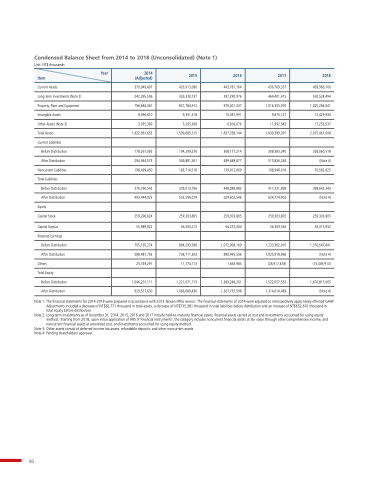
Condensed Balance Sheet from 2014 to 2018 (Unconsolidated) (Note 1)
Unit: NT$ thousands
Current Assets
Long-term Investments (Note 2) Property Plant and Equipment Intangible Assets
Other Assets
(Note 3)
Total Assets
Current Liabilities
Before Distribution
After Distribution
Noncurrent Liabilities
Total Liabilities
Before Distribution
After Distribution
Equity
Capital Stock
Capital Surplus Retained Earnings
Before Distribution
After Distribution
Others
Total Equity
Before Distribution
After Distribution
469 966 106
550 524 494 1 1 025 286 941 12 429 930 17 253 537 2 075 461 008
  328 060 518 (Note 4) 70 582 825
  398 643 343 (Note 4)   259 303 805
56 315 932
  1 1 376 647 841 (Note 4) (15 449 913)
  1 1 676 817 665 (Note 4) Item
Year 2014 (Adjusted)
2015
2016
2017
2018 370 949 497 426 913 080
443 781 164
436 769 337
242 395 596
326 330 737
397 290 976 464 401 415
796 684 361 831 784 912
979 401 337
1 1 016
355 970
8 8 996 810
9 9 391 418
10 047 991
9 870 127
3 3 3 935 389
5 5 265 368
6 6 6 6 816 676 11 992 542
1 1 422 961 653
1 1 599 685 515
1 1 837 338 144
1 1 939 389
391         178 261 092
194 299 278
308 177 214
308 383 240
294 944 573
349 881 561
489 689 877
515
826 284
198 499 450
183 714 518 139 912
669
108 948 618
        376 760 542
378 013 796 448 089 883
417 331 858
493 444 023
533 596
079
629 602 546
624 774 902
        259 296 624 259 303 805
259 303 805
259 303 805
55 989 922
56 300 215
56 272 304
56 309 536
        705 165 274
894 293 586
1 1 072 008
169
1 1 233 362 010
588 481 793
738 711 303 890 495 506
1 1 025 918 966 25 749 291
11 11 774 113
1 663 983
(26 917 818)
        1 1 1 1 1 046 201 111
1 1 1 1 221 671 719
1 1 389
248 261 1 522
057 533 929 517 630
1 066 089 436 1 207 735 598
1 1 1 314 614 489 Note 1: The The financial financial statements statements for 2014-2018 were were prepared in in in accordance with 2013 Taiwan-IFRSs version The The financial financial statements statements of 2014 2014 were were adjusted to retrospectively apply newly effected GAAP Adjustments included a a a a a a a a a a a a a a decrease decrease of of of NT$82 771
thousand thousand thousand in in in in in total total assets a a a a a a a a a a a a a a decrease decrease of of of NT$735 381 thousand thousand thousand in in in in in total total liabilities before distribution and and and and an an an an an increase of of of NT$652 610 thousand thousand thousand in in in in in total equity before distribution Note 2: Long-term investments investments as as as of December 31 2014 2015
2016
and and 2017
include held-to-maturity financial financial assets assets financial financial assets assets carried at at cost and and investments investments accounted for using equity method Starting from 2018 upon initial application of IFRS 9 "Financial Instruments" the the category includes noncurrent financial assets at at at fair value through other comprehensive income and noncurrent financial assets at amortized cost and investments accounted for using equity method Note 3: Other assets assets assets consist of deferred income tax assets assets assets refundable deposits and other noncurrent assets assets assets Note 4: Pending shareholders' approval 90 