
Page 91 - TSMC 2018 Annual Report
P. 91
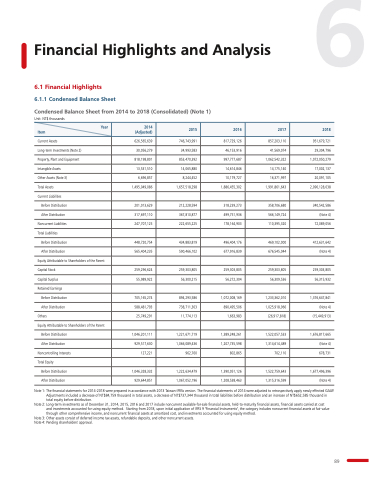
Financial Highlights and Analysis
6 1 Financial Highlights 6 1 1 1 1 Condensed Balance Sheet
Condensed Balance Sheet
from 2014 to 2018 (Consolidated) (Note 1)
Unit: NT$ thousands
Current Assets
Long-term Investments (Note 2) Property Plant and Equipment Intangible Assets
Other Assets
(Note 3)
Total Assets
Current Liabilities
951 679 721 29 304 796 1 072 050 279 17 002 137 20 091 105 2 2 090 128 038
  340 542 586 (Note 4) 72 089 056
  412 631 642 (Note 4)   259 303 805 56
315 932
  1 1 376 647 841 (Note 4) (15 449 913)
  1 1 676 817 665 (Note 4) 678 731
  1 677 496 396 (Note 4) Item
Year
2014 (Adjusted)
2015
2016
46 153 916
2017
2018 626 565 639
746 743 991
817 729 126
857 203 110
30 056
279 34 993 583
41 569 074
818 198 801
853 470 392
997 777 687
1 062 542 322
13 531 510
14 065 880
14 14 614 846
14 14 175 140
6 6 6 696 857 8 244 452
10 179 727
16
371 997 1 495 049 086
1 1 657 518 298
1 886 455 302
1 1 1 991
861 643
        201 013 629
212 228 594
318 239 273
358 706 680
317 697 110
367 810 877
499 751 936
566 149 724
247 707 125
222 655 225
178 164 903
110
395 320
  434 883 819
  496 404 176
    448 720 754
469 102 000
565 404 235
590 466 102 677 916
839
676 545 044
    1 663 983
    259 296 624
259 303 805 259 303 805 259 303 805 55 989 922
56
300 215
56
272 304 56
309 536
        705 165 274
894 293 586 738 711 303 1 1 072 008 169
1 1 233 362 010
588 481 793
890 495 506
1 1 025 918 966
25 749 291
11 11 774 113
(26 917 818)
        1 1 1 1 1 046 201 111
1 1 1 1 221 671 719
1 1 389 248 261
1 522 057 533
929 517 630
1 066 089 436
1 207 735 598
1 1 1 314 614 489
127 221 962 760
802 865
702 110
        1 046 328 332
1 222 634 479
1 1 1 390 051 126
1 522 759 643
929 644 851
1 1 067 052 196
1 208 538 463
1 1 1 315 316 599
Before Distribution
After Distribution
Noncurrent Liabilities
Total Liabilities
Before Distribution
After Distribution
Equity Attributable to Capital Stock
Capital Surplus Retained Earnings
Before Distribution
After Distribution
Others
Equity Attributable to Before Distribution
After Distribution
Shareholders of the Parent
Shareholders of the Parent
Noncontrolling Interests Total Equity Before Distribution
After Distribution
Note 1: The The financial financial statements statements for 2014-2018 were were prepared in in in accordance with 2013 Taiwan-IFRSs version The The financial financial statements statements of 2014 2014 were were adjusted to retrospectively apply newly effected GAAP Adjustments included a a a a a a a a a a a a a a decrease decrease of of of NT$84 759 thousand thousand thousand in in in in in total total assets a a a a a a a a a a a a a a decrease decrease of of of NT$737 344 thousand thousand thousand in in in in in total total liabilities before distribution and and and and an an an an an increase of of of NT$652 585 thousand thousand thousand in in in in in total equity before distribution Note 2: Long-term investments as as as as of December 31 2014 2015
2016
and 2017
include noncurrent available-for-sale financial financial financial assets assets assets held-to-maturity financial financial financial assets assets assets financial financial financial assets assets assets carried at at cost and investments accounted for using equity method Starting from 2018 upon initial application of IFRS 9 "Financial Instruments" the category includes noncurrent financial assets at at at fair value through other comprehensive income and and noncurrent financial assets at amortized cost and and investments accounted for using equity method Note 3: Other assets assets assets consist of deferred income tax assets assets assets refundable deposits and other noncurrent assets assets assets Note 4: Pending shareholders' approval 89 