
Page 275 - TSMC 2018 Annual Report
P. 275
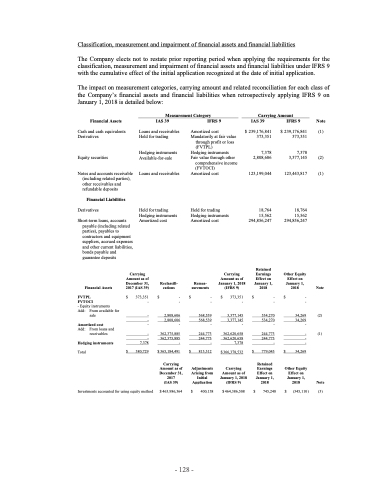
Classification, measurement and impairment of financial assets and financial liabilities
The Company elects not to restate prior reporting period when applying the requirements for the classification, measurement and impairment of financial assets and financial liabilities under IFRS 9 with the cumulative effect of the initial application recognized at the date of initial application.
The impact on measurement categories, carrying amount and related reconciliation for each class of
the Company’s financial assets and financial liabilities when retrospectively applying IFRS 9 on
January 1, 2018 is detailed below:
Financial Assets
Cash and cash equivalents Derivatives
Equity securities
Notes and accounts receivable (including related parties), other receivables and refundable deposits
Financial Liabilities
Derivatives
Short-term loans, accounts payable (including related parties), payables to contractors and equipment suppliers, accrued expenses and other current liabilities, bonds payable and guarantee deposits
Measurement Category
Carrying Amount
IAS 39
Loans and receivables Held for trading
Hedging instruments Available-for�sale
Loans and receivables
Held for trading Hedging instruments Amortized cost
IFRS 9
Amortized cost Mandatorily at fair value
through profit or loss
(FVTPL)
Hedging instruments Fair value through other
comprehensive income
(FVTOCI) Amortized cost
Held for trading Hedging instruments Amortized cost
IAS 39
$ 239,176,841 373,351
7,378 2,808,606
123,199,044
18,764
15,562 294,856,247
Retained Earnings Effect on January 1, 2018
IFRS 9 Note
$ 239,176,841 (1) 373,351
7,378 3,377,145 (2)
123,443,817 (1)
18,764
15,562 294,856,247
Other Equity Effect on January 1, 2018
Financial Assets
FVTPL
sale
Amortized cost
Add: From loans and receivables
Hedging instruments
Total
Carrying Amount as of December 31, 2017 (IAS 39)
Reclassifi- cations
Remea- surements
Carrying Amount as of January 1, 2018 (IFRS 9)
Note
$ 373,351 $
FVTOCI ------ - Equity instruments
Add: From available for
- - -
-
- 7,378
$ 380,729
2,808,606 2,808,606 -
362,375,885 362,375,885 -
$ 365,184,491
Carrying Amount as of December 31, 2017
(IAS 39)
$ 463,986,364
568,539 568,539 -
244,773 244,773 -
813,312
Adjustments Arising from Initial Application
$ 400,138
3,377,145 3,377,145 -
362,620,658 362,620,658 7,378
$ 366,378,532
Carrying Amount as of January 1, 2018 (IFRS 9)
$ 464,386,508
534,270 534,270 -
244,773 244,773 -
779,043
Retained Earnings Effect on January 1, 2018
745,248
34,269 (2) 34,269
-
- (1) -
-
$ 34,269
Other Equity Effect on January 1,
- $
- $ 373,351 $
- $
-
$
$
$
Investments accounted for using equity method
$
2018 Note
(345,110 ) (3)
- 128 -
