
Page 197 - TSMC 2018 Annual Report
P. 197
Name of Associate
VIS GUC Xintec
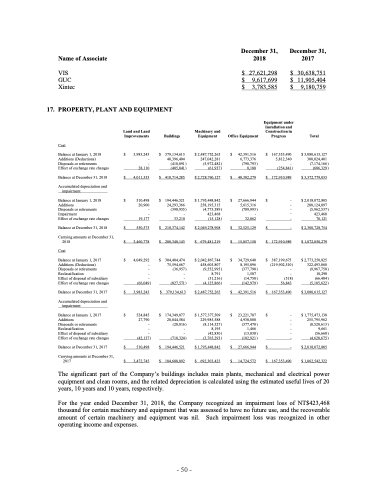
17. PROPERTY, PLANT AND EQUIPMENT
December 31, 2018
$ 27,621,298 $ 9,617,699 $ 3,783,585
December 31, 2017
$ 30,638,751 $ 11,905,404
$
9,180,759
Total
$ 3,080,615,127 300,024,401
(7,174,166 ) (686,329 )
$ 3,372,779,033
$ 2,018,072,805 288,124,897
(5,962,537 ) 423,468 70,121
$ 2,300,728,754 $ 1,072,050,279
$ 2,773,250,825 322,493,860
(9,967,750 ) 10,298
(66,484 ) (5,105,622 )
$ 3,080,615,127
$ 1,775,473,138 255,795,962
(8,520,613 ) 9,661
(56,668 ) (4,628,675 )
$ 2,018,072,805
$ 1,062,542,322
Cost
Balance at January 1, 2018 Additions (Deductions) Disposals or retirements
Effect of exchange rate changes
Balance at December 31, 2018
Accumulated depreciation and impairment
Balance at January 1, 2018 Additions
Disposals or retirements Impairment
Effect of exchange rate changes
Balance at December 31, 2018
Carrying amounts at December 31, 2018
Cost
Balance at January 1, 2017 Additions (Deductions) Disposals or retirements Reclassification
Effect of disposal of subsidiary Effect of exchange rate changes
Balance at December 31, 2017
Accumulated depreciation and impairment
Balance at January 1, 2017 Additions
Disposals or retirements Reclassification
Effect of disposal of subsidiary Effect of exchange rate changes
Balance at December 31, 2017
Carrying amounts at December 31, 2017
$
$
$
$ $
$
$
$
$
$
3,983,243 - - 28,110
4,011,353
510,498 20,900 - - 19,177
550,575 3,460,778
4,049,292 - - - -
(66,049 ) 3,983,243
524,845 27,790 - - -
(42,137 ) 510,498
3,472,745
$
$
$
$ $
$
$
$
$
$
Land and Land Improvements
Buildings
379,134,613 40,396,404
(410,891 ) (405,841 )
418,714,285
194,446,521 24,293,366
(398,955 ) -
33,210 218,374,142
200,340,143
304,404,474 75,594,667
(36,957 ) -
- (827,571 )
379,134,613
174,349,077 20,844,584
(28,816 ) -
- (718,324 )
194,446,521
184,688,092
Machinery and Equipment
$ 2,487,752,265 247,042,281
(5,972,482 ) (61,937 )
$ 2,728,760,127
$ 1,795,448,842 258,195,315
(4,773,589 ) 423,468
(15,128 ) $ 2,049,278,908
$ 679,481,219
$ 2,042,867,744 458,605,807
(9,552,995 ) 8,791
(51,216 ) (4,125,866 )
$ 2,487,752,265
$ 1,577,377,509 229,985,588
(8,114,327 ) 8,195
(42,830 ) (3,765,293 )
$ 1,795,448,842
$ 692,303,423
Office Equipment
$ 42,391,516 6,773,376
(790,793 ) 8,180
$ 48,382,279
$ 27,666,944 5,615,316
(789,993 ) -
32,862 $ 32,525,129
$ 15,857,150
$ 34,729,640 8,195,896
(377,798 ) 1,507
(14,750 ) (142,979 )
$ 42,391,516
$ 23,221,707 4,938,000
(377,470 ) 1,466
(13,838 ) (102,921 )
$ 27,666,944
$ 14,724,572
Equipment under Installation and Construction in Progress
$ 167,353,490 5,812,340 -
(254,841 ) $ 172,910,989
$ - - - -
- $ -
$ 172,910,989
$ 387,199,675 (219,902,510 )
-
- (518 )
56,843 $ 167,353,490
$ - - -
- - -
$ -
$ 167,353,490
The significant part of the Company’s buildings includes main plants, mechanical and electrical power
equipment and clean rooms, and the related depreciation is calculated using the estimated useful lives of 20 years, 10 years and 10 years, respectively.
For the year ended December 31, 2018, the Company recognized an impairment loss of NT$423,468 thousand for certain machinery and equipment that was assessed to have no future use, and the recoverable amount of certain machinery and equipment was nil. Such impairment loss was recognized in other operating income and expenses.
- 50 -
