
Page 165 - TSMC 2018 Annual Report
P. 165
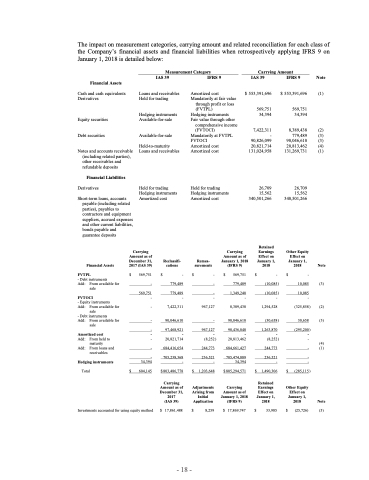
 The impact on measurement categories, carrying amount and related reconciliation for each class of the Company’s financial assets and financial liabilities when retrospectively applying IFRS 9 on January 1, 2018 is detailed below:
     Financial Assets
Cash and cash equivalents Derivatives
Equity securities
Debt securities
Notes and accounts receivable (including related parties), other receivables and refundable deposits
Financial Liabilities
Derivatives
Short-term loans, accounts payable (including related parties), payables to contractors and equipment suppliers, accrued expenses and other current liabilities, bonds payable and guarantee deposits
IAS 39
$ 553,391,696
569,751 34,394
IFRS 9 Note
$ 553,391,696 (1)
569,751 34,394
8,389,438 (2) 779,489 (3) 90,046,610 (3) 20,813,462 (4) 131,269,731 (1)
26,709
15,562 340,501,266
Other Equity Effect on January 1,
2018 Note
-
10,085 (3)
IAS 39
Loans and receivables Held for trading
Hedging instruments Available-for-sale
Available-for-sale
Held-to-maturity Loans and receivables
Held for trading Hedging instruments Amortized cost
IFRS 9
Amortized cost Mandatorily at fair value
through profit or loss
(FVTPL)
Hedging instruments Fair value through other
comprehensive income
(FVTOCI)
Mandatorily at FVTPL
FVTOCI 90,826,099
Measurement Category
Carrying Amount
  Financial Assets
FVTPL
- Debt instruments
Add: From available for
sale
Carrying Amount as of December 31, 2017 (IAS 39)
$ 569,751
-
Reclassifi- cations
Remea- surements
Carrying Amount as of January 1, 2018 (IFRS 9)
- $ 569,751 $ - 779,489
- 1,349,240
Retained Earnings Effect on January 1, 2018
$
- 779,489 779,489
$
- $ (10,085 )
Amortized cost Amortized cost
Held for trading Hedging instruments Amortized cost
20,821,714 131,024,958
26,709
15,562 340,501,266
7,422,311 -
      569,751
FVTOCI ------
      - Equity instruments
Add: From available for
sale
- Debt instruments
Add: From available for sale
Amortized cost
Add: From held to maturity
Add: From loans and receivables
Hedging instruments
Total
-
- -
-
- - -
34,394 $ 604,145
7,422,311
90,046,610 97,468,921
-
20,821,714 684,416,654 705,238,368
- $ 803,486,778
Carrying Amount as of December 31, 2017
(IAS 39)
$ 17,861,488
967,127
- 967,127
8,389,438
90,046,610 98,436,048
(10,085 ) 1,294,528
10,085 (325,858 ) (2)
(30,658 1,263,870
-
)
30,658 (3) (295,200 )
-
            (8,252 ) 244,773 236,521
- 1,203,648
20,813,462 684,661,427 705,474,889
34,394 $ 805,294,571
Carrying Amount as of January 1, 2018 (IFRS 9)
$ 17,869,747
(8,252
244,773
236,521 -
- -
--
)-
- (1)
(4)
                  $
$ 1,490,306 $
(285,115 )
            Investments accounted for using equity method
Adjustments Arising from Initial Application
$ 8,259
$
Retained Earnings Effect on January 1, 2018
33,985
Other Equity Effect on January 1, 2018
$ (25,726)
Note
(5)
- 18 -
