
Page 101 - TSMC 2018 Annual Report
P. 101
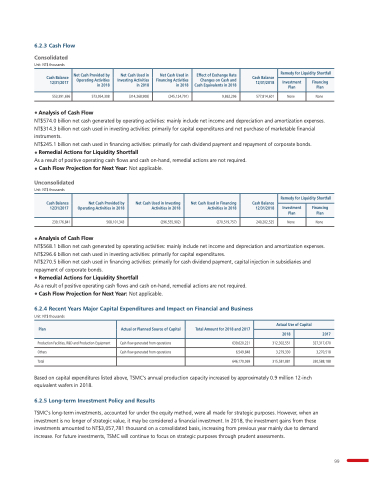
6 2 3 Cash Flow
Consolidated
Unit: NT$ thousands
553 391 696 None
None
• Analysis of Cash Flow
NT$574 0 billion net net cash generated by operating activities: mainly include net net income and and depreciation and and amortization expenses NT$314 3 3 billion net net cash used in in in in investing activities: primarily for capital expenditures and net net purchase of marketable financial instruments NT$245 1 billion net cash cash used in in in financing activities: primarily for cash cash dividend payment payment and repayment of corporate bonds • Remedial Actions for Liquidity Shortfall
As a a a a a a a a a result of positive operating cash cash flows and and cash cash on-hand remedial actions are not required • Cash Flow
Projection for Next Year: Not applicable Unconsolidated
Unit: NT$ thousands
239 176 841 None
None
• Analysis of Cash Flow
NT$568 1 billion net net cash generated by operating activities: mainly include net net income and and depreciation and and amortization expenses NT$296 6 6 billion net cash used in in in investing activities: primarily for capital expenditures NT$270 5 billion net cash cash used in in in in in financing activities: primarily for cash cash dividend payment capital injection in in in in in subsidiaries and repayment of corporate bonds 573 954 308
9 9 862 296 99 Cash Balance 12/31/2017
Cash Balance 12/31/2017
Net Cash Provided by Operating Activities in 2018 Net Cash Provided by Operating Activities in in 2018 Net Cash Used in Investing Activities in 2018 Net Cash Used in Financing Activities in 2018 Net Cash Used in in Investing Activities in 2018 Net Cash Used in in in Financing Activities in 2018 Cash Balance 12/31/2018
Remedy for Liquidity Shortfall
Investment Plan Financing Plan 568 101 343 (296 555 902)
(270 519 757)
240 202 525
None
• Remedial Actions for Liquidity Shortfall
As a a a a a a a a a result of positive operating cash cash flows and and cash cash on-hand remedial actions are not required • Cash Flow
Projection for Next Year: Not applicable 6 2 4 Recent Years Major Capital Expenditures and and Impact on Financial and and Business
Unit: NT$ thousands
Production Production Facilities R&D and Production Production Equipment Others
Total Based on on on capital expenditures listed above TSMC’s annual production capacity increased by approximately 0 9 million 12-inch equivalent wafers in 2018 6 2 5 Long-term Investment Policy and Results
327 317 670 3 270 518 330 588 188
Plan Actual or Planned Source of Capital Total Amount for 2018 and 2017
Actual Use of Capital 2018 2017
Cash flow generated from operations 639 620 221
312 302 551
Cash flow generated from operations 6 549 848
3 3 3 279 330 646 170 069
315
581 881 TSMC’s long-term investments accounted for for under the equity method were all
made for for strategic purposes However when an investment investment investment is no longer of strategic value it may be considered a a a a a a a financial investment investment investment In 2018 the the investment investment investment gains from these investments amounted to to NT$3 057 781 thousand on on a a a a a a a a a consolidated
basis increasing from previous year mainly due to to demand increase For future investments TSMC will continue to focus on on strategic purposes through prudent assessments Effect of Exchange Rate Changes on Cash and Cash Equivalents in 2018 Cash Balance 12/31/2018
Remedy for Liquidity Shortfall
Investment Plan Financing Plan (314 268 908)
(245 124 791)
577 814 601
None
