
Page 222 - 2017 TSMC Annual Report
P. 222
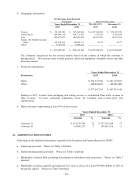
b. Geographic information
Taiwan
United States
Asia 194,477,093 Europe, the Middle East and
Africa 68,538,366 Others 3,353,674
$ 977,447,241
Net Revenue from External Customers
Years Ended December 31
Non-current Assets
2017
2016
$ 127,062,984 610,371,107 146,907,470
58,042,311 5,554,472
$ 947,938,344
December 31, 2017
$ 1,027,963,202 7,515,835 44,213,422
8,123 -
$ 1,079,700,582
December 31, 2016
$ 991,567,870 8,245,054 14,071,364
8,677 -
$ 1,013,892,965
$ 90,129,390 620,948,718
The Company categorized the net revenue mainly based on the country in which the customer is headquartered. Non-current assets include property, plant and equipment, intangible assets and other noncurrent assets.
c. Production information
Starting in 2017, revenue from packaging and testing services is reclassified from wafer revenue to other revenue. To have consistent comparative basis, the Company had revised prior year classification.
d. Major customers representing at least 10% of net revenue
Years Ended December 31
Production 2017
Wafer $ 874,572,620 Others 102,874,621
$ 977,447,241
2016
$ 861,170,855 86,767,489
$ 947,938,344
Years Ended December 31 2017 2016
41.
Customer A Customer B
ADDITIONAL DISCLOSURES
Amount
$ 214,228,766 64,096,227
% Amount %
22 $ 157,185,418 17 7 107,463,238 11
Following are the additional disclosures required by the Securities and Futures Bureau for TSMC:
a. Financings provided: Please see Table 1 attached;
b. Endorsement/guarantee provided: Please see Table 2 attached;
c. Marketable securities held (excluding investments in subsidiaries and associates): Please see Table 3 attached;
d. Marketable securities acquired and disposed of at costs or prices of at least NT$300 million or 20% of the paid-in capital: Please see Table 4 attached;
- 74 -
- 74 -
