
Page 221 - 2017 TSMC Annual Report
P. 221
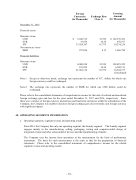
December 31, 2016
Financial assets
Monetary items USD
EUR
JPY Non-monetary items
HKD
Financial liabilities
Monetary items USD
EUR JPY
Note 1:
$
5,042,715 19,556 37,024,347
257,056
4,000,930 183,922 61,062,114
Foreign Currencies (In Thousands)
Exchange Rate (Note 1)
32.199 34.30 0.2775
4.15
32.199 34.30 0.2775
Carrying Amount (In Thousands)
$ 162,370,381 670,767 10,274,256
1,066,780
128,825,952 6,308,513 16,944,737
(Concluded)
Except as otherwise noted, exchange rate represents the number of N.T. dollars for which one foreign currency could be exchanged.
Note 2: The exchange rate represents the number of RMB for which one USD dollars could be exchanged.
Please refer to the consolidated statements of comprehensive income for the total of realized and unrealized foreign exchange gain and loss for the years ended December 31, 2017 and 2016, respectively. Since there were varieties of foreign currency transactions and functional currencies within the subsidiaries of the Company, the Company was unable to disclose foreign exchange gain (loss) towards each foreign currency with significant impact.
40. OPERATINGSEGMENTSINFORMATION
a. Operating segments, segment revenue and operating results
From 2016, the Company has only one operating segment, the foundry segment. The foundry segment engages mainly in the manufacturing, selling, packaging, testing and computer-aided design of integrated circuits and other semiconductor devices and the manufacturing of masks.
The Company uses the income from operations as the measurement for the basis of performance assessment. The basis for such measurement is the same as that for the preparation of financial statements. Please refer to the consolidated statements of comprehensive income for the related segment revenue and operating results.
- 73 -
- 73 -
