
Page 161 - 2017 TSMC Annual Report
P. 161
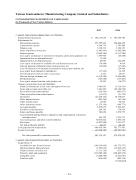
Taiwan Semiconductor Manufacturing Company Limited and Subsidiaries
CONSOLIDATED STATEMENTS OF CASH FLOWS (In Thousands of New Taiwan Dollars)
CASH FLOWS FROM OPERATING ACTIVITIES Income before income tax
Adjustments for:
Depreciation expense Amortization expense Finance costs
Share of profits of associates Interest income
Loss (gain) on disposal or retirement of property, plant and equipment, net Impairment loss on intangible assets
Impairment loss on financial assets
Loss (gain) on disposal of available-for-sale financial assets, net
Gain on disposal of financial assets carried at cost, net
Loss on disposal of investments accounted for using equity method, net Loss (gain) from disposal of subsidiaries
Unrealized gross profit on sales to associates
Gain on foreign exchange, net
Dividend income
Loss (gain) arising from fair value hedges, net
$
2017
396,133,030
255,795,962 4,346,736 3,330,313
(2,985,941) (9,464,706) 1,097,908
13,520
29,603 (76,986) (12,809)
- (17,343)
4,553 (9,118,580) (145,588)
30,293
$
2016
385,959,380
220,084,998 3,743,406 3,306,153
(3,495,600) (6,317,500) (46,548)
- 122,240 4,014
(37,241) 259,960 36,105 29,073
(2,656,406) (137,401) (16,973)
(6,326,561) (49,342,698) (463,837) (21,770)
18,370,037 (41,554)
94,512 (349,771)
7,295,491 139,818 1,979,775
1,935,113 3,693,638 7,931,877
46,163 585,777,893
(45,943,301) 539,834,592
(83,275,573) (33,625,353) (533,745) (328,045,270) (4,243,087) (805,318)
(Continued)
Changes in operating assets and liabilities:
Financial instruments at fair value through profit or loss
Notes and accounts receivable, net
Receivables from related parties
Other receivables from related parties
Inventories (25,229,101) Other financial assets (502,306) Other current assets 12,085 Other noncurrent assets (1,276,130) Accounts payable 2,572,072 Payables to related parties 394,182 Salary and bonus payable 582,054 Accrued profit sharing bonus to employees and compensation to directors
and supervisors 525,129 Accrued expenses and other current liabilities 30,435,424 Provisions (4,057,900)
Net defined benefit liability Cash generated from operations Income taxes paid
Net cash generated by operating activities
CASH FLOWS FROM INVESTING ACTIVITIES Acquisitions of:
Available-for-sale financial assets Held-to-maturity financial assets Financial assets carried at cost Property, plant and equipment Intangible assets
Land use right
44,615 648,938,549
(63,620,382) 585,318,167
(100,510,905) (1,997,076) (1,313,124)
(330,588,188) (4,480,588) (819,694)
- 13 -
- 13 -
5,645,093 1,061,805
(214,565) (13,873)
