
Page 160 - 2017 TSMC Annual Report
P. 160
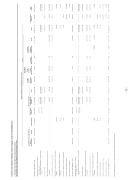
Taiwan Semiconductor Manufacturing Company Limited and Subsidiaries
CONSOLIDATED STATEMENTS OF CHANGES IN EQUITY (In Thousands of New Taiwan Dollars, Except Dividends Per Share)
BALANCE, JANUARY 1, 2016
25,930,380
$ 259,303,805
$ 56,300,215
$177,640,561
$ 716,653,025 $ 894,293,586
$
11,039,949
$
734,771
$
(607) $ -
$ 11,774,113
$ 962,760 --
Appropriations of prior year’s earnings
Legal capital reserve
Cash dividends to shareholders - NT$6 per share
- - -
- - -
- - -
30,657,384 - 30,657,384
(30,657,384) - (155,582,283) (155,582,283) (186,239,667) (155,582,283)
- - -
- - -
- -
- -
- -
-
- (155,582,283) - (155,582,283)
- -
- (155,582,283) (155,582,283)
Total
Net income in 2016
-
-
-
-
334,247,180 334,247,180
-
-
- -
- 334,247,180
91,056
334,338,236
Other comprehensive income (loss) in 2016, net of income tax
- -
- -
- -
- -
(950,314) (950,314) 333,296,866 333,296,866
(9,378,712) (9,378,712)
(732,130) (732,130)
712 - 712 -
(10,110,130) (11,060,444) (10,110,130) 323,186,736
(6,745) 84,311
(11,067,189) 323,271,047
Total comprehensive income (loss) in 2016
Disposal of investments accounted for using equity method
-
-
(56,169)
-
- -
-
-
- -
- (56,169)
-
(56,169)
Adjustments to share of changes in equities of associates
- - - -
- - - -
21,221 7,037 - - 56,272,304
- - - -
- - - - - - - -
- - - -
- - - -
- -
- -
- -
- -
- 21,221 - 7,037 - - - -
9 (7,037) (235,224) (1,954)
21,230 - (235,224)
From share of changes in equities of subsidiaries Decrease in noncontrolling interests
Effect of disposal of subsidiary
BALANCE, DECEMBER 31, 2016 Appropriations of prior year’s earnings
25,930,380
259,303,805
208,297,945
863,710,224 1,072,008,169
1,661,237
2,641
105 -
1,663,983 1,389,248,261
802,865
(1,954) 1,390,051,126
Legal capital reserve
Cash dividends to shareholders - NT$7 per share
- - -
- - -
- - -
33,424,718 - 33,424,718
(33,424,718) - (181,512,663) (181,512,663) (214,937,381) (181,512,663)
- - -
- - -
- -
- -
- -
- - - (181,512,663) - (181,512,663)
- - -
- (181,512,663) (181,512,663)
Total
Net income in 2017
-
-
-
-
343,111,476 343,111,476
-
-
- -
- 343,111,476
35,372
343,146,848
Other comprehensive income (loss) in 2017, net of income tax
- -
- -
- -
- -
(244,972) (244,972) 342,866,504 342,866,504
(28,358,917) (28,358,917)
(216,715) (216,715)
4,121 - 4,121 -
(28,571,511) (28,816,483) (28,571,511) 314,294,993
(5,148) 30,224
(28,821,631) 314,325,217
Total comprehensive income (loss) in 2017
Adjustments to share of changes in equities of associates
- - - - -
- - - - -
7,085 10,994 19,153
- - - - -
- - - - - - - - - -
- - - - -
- - - - -
- (10,290)
- -
- -
- -
- -
(10,290) (3,205) - 10,994 - 19,153 - - - - (26,917,818) $1,522,057,533
- (10,994) 1,684 (113,675) (7,994)
(3,205) -
From share of changes in equities of subsidiaries Donation from shareholders
Decrease in noncontrolling interests
Effect of disposal of subsidiary
-
20,837 (113,675) (7,994)
BALANCE, DECEMBER 31, 2017
25,930,380
$ 259,303,805
- $ 56,309,536
$ 241,722,663
$ 991,639,347 $1,233,362,010
$ (26,697,680)
$
(214,074)
$
4,226 $ (10,290)
$
$
702,110
$1,522,759,643
The accompanying notes are an integral part of the consolidated financial statements.
Capital Stock Shares
- Common Stock Amount
Retained Earnings Unappropriated
Foreign from Currency Available-
Unearned Stock-Based Employee Compensation
(In Thousands)
Capital Surplus
Earnings Total
Reserve
Financial Assets
Total
Total
Legal Capital Reserve
Translation for-sale
Cash Flow Hedges Reserve
Noncontrolling Interests
Total Equity
Equity Attributable to Shareholders of the Parent
- 12 -
- 12 -
Unrealized Gain/Loss
Others
$1,221,671,719
$1,222,634,479
