
Page 182 - TSMC 2024 Annual Report
P. 182
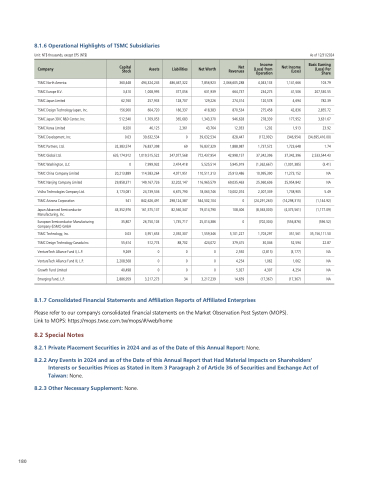
8 1 6 Operational Highlights of TSMC Subsidiaries
Unit: NT$ NT$ thousands except EPS (NT$)
TSMC North America
TSMC Europe B V TSMC Japan Limited
TSMC Design Technology Japan Inc TSMC Japan 3DIC R&D Center Inc TSMC Korea Limited
TSMC Development Inc TSMC Partners Ltd TSMC Global Ltd TSMC Washington LLC
TSMC China Company Limited
TSMC Nanjing Company Limited
VisEra Technologies Company Ltd TSMC Arizona Corporation
Japan Advanced Semiconductor Manufacturing Inc European Semiconductor Manufacturing Company (ESMC) GmbH
TSMC Technology Inc TSMC Design Technology Canada Inc VentureTech Alliance Fund II L P VentureTech Alliance Fund III L P Growth Fund Limited
Emerging Fund L P 360 448
3 410
62 760
156 900
512 540
8 920
0 0 03
32 383 574
635 174 912
0 20
213 889
29 858 371
3 3 173 081
541
43 352 976
35 807
0 0 03
55 614
9 9 269
2 2 208 568
40
498
2 886 959
494 324 245
1 008 995
257 933
604 720
1 709 053
46 125
39 632 534
76 837 398
1 1 1 019 515 522
7 999 932
114 583 264
149 167 726
24 739 536
842 626 491
161 575 137
26 750 103
3 3 951 653
512 774
0 0 0 3 3 217 273
486 467 322
377 056
128 707
186 337
365 683
2 361
0 69
247 077 568
2 474 418
4 071 951 32 202 147
6 6 675 790
298 124 387
82 560 347
1 1 735 717
2 2 392 307
88 702
0 0 0 34
7 856 923 2 2 2 066 605 288
631 939 664 737
129 226 274 314
418
383 870 534
1 343 370 946 628
43 764 12 933
39 632 534
828 447
76 837 329 1 888 987
772 437 954 42 998 157
5 5 5 5 5 5 525 514 5 5 5 5 5 5 945 919
110 511 313 25 913 486 116 965 579 69
035 463
18 063 746 10
002 074
544 502 104 0 0 0 79 79 014 790
108 406
25 014 386 0 0 1 1 1 559 346 5 5 5 101 227
424 072 379 415
0 2 2 592
0 4 4 254
0 5 927
3 3 217 239 14
659
4 4 043 133
234 275
120 578
275
458
278 339
1 202 (172 992)
1 737
572
37 342 396
(1 362 667)
10
995
390
25 960 606
2 007 339
(24 291 263)
(8 363 000)
(702 304)
1 703 297
30 046
(2 815)
1 062
4 307
(17 367)
1 1 1 141 666
41 506
4 4 694
42 836
177 952
1 1 913 (346 954)
1 723 648
37 342 396
(1 001 385)
11 273
152
25 954 842 1 738 905
(14 298 315)
(4 375 561)
(556 876)
351 561 52 594
(3 177)
1 062
4 4 254
(17 367)
As of 12/31/2024
103
79 207 530 55 782 39 2 2 855 72 3 3 631 67 23 92 (34 695 416 00)
1 74
2 533 544 43 (3 41)
NA
NA
5 49 (1 144 92)
(1 177 09)
(596 52)
35 156 111 50 22
87
NA
NA
NA
NA
Company Capital Stock
Assets
Liabilities
Net Worth
Net Revenues
Income (Loss) from Operation Net Income (Loss) Basic Earning (Loss) Per Share
180
8 1 7 Consolidated Financial Statements and Affiliation Reports of Affiliated Enterprises
Please refer to our company's consolidated financial statements on on on the Market Observation Post System (MOPS) Link to MOPS: https://mops twse com tw/mops/#/web/home
8 2 Special Notes
8 2 2 2 1 Private Placement Securities in 2024
and as of of the Date of of this Annual Report: None 8 2 2 2 2 2 2 2 2 Any Events in 2024
and as of of the Date of of this Annual Report that Had Material Impacts on Shareholders’ Interests or Securities Securities Prices as Stated in Item 3 3 Paragraph 2 of of of Article 36 of of of Securities Securities and Exchange Act of of of Taiwan: None 8 2 3 Other Necessary Supplement: None 