
Page 125 - TSMC 2022 Annual Report
P. 125
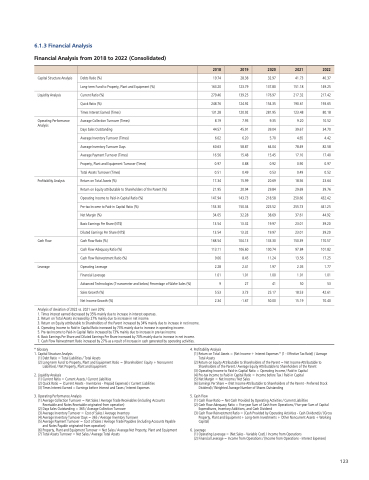
6 1 3 Financial Analysis
Financial Analysis
from 2018 to 2022 (Consolidated)
Capital Structure Analysis
Liquidity Analysis
Operating Performance Analysis
Profitability Analysis
Cash Flow
Leverage
Debts Ratio (%)
Long-term Fund to Property Plant and Equipment (%)
Current Ratio (%)
Quick Ratio (%)
Times Times Interest Earned (Times)
Average Collection Turnover (Times)
Days Sales Outstanding
Average Inventory Turnover (Times)
Average Inventory Turnover Days Average Payment Turnover (Times)
Property Plant and Equipment Turnover (Times)
Total Assets Turnover (Times)
Return on Total Assets (%)
Return on Equity attributable to Shareholders of the Parent
(%)
Operating Income
to Paid-in Capital Ratio (%)
Pre-tax Income
to Paid-in Capital Ratio (%)
Net Margin (%)
Basic Earnings Per Share (NT$)
Diluted Earnings Per Share (NT$)
Cash Flow
Ratio (%)
Cash Flow
Adequacy Ratio (%)
Cash Flow
Reinvestment Ratio (%)
Operating Leverage
Financial Leverage
Advanced Technologies (7-nanometer and below) Percentage of Wafer Sales (%)
Sales Growth (%)
Net Income
Growth (%)
19 74 163 20 279 46
248 76
131 28 8 19 44 57
6 02 60 63
16 56 0 97 0 51 17 34 21 95
147 94 153 30 34 05 13 54
13 54
168 54
113 11 11 9 06
2 2 28 1 1 01 9 5 5 53
2 34 28 38 123 79 139 25 124 92 120
92 7 95
45 91 6 20 58 87 15
48
0 88 0 49 15
99 20 94 143 73 150 34 32
28 13 32
13 32
104 13 106 60 8 45 2 41
1 1 01 27 3 3 73 -1 67
32
97 137 80 176 97 154 35 281 95
9 35 39
04 5 70 64 04 15
45 0 92 0 53
20 69 29 84 218 58 225 52 38 69 19 97 19 97 133 30 100 74 11 24
1 97 1 00 41
25 17 50 00 41
73 151 18 217 32
190 61 123 48
9 20 39
67
4 65 78 49 17 10 0 0 90
0 49 18 56 29 69 250 66 255 73 37 61 23 01 23 01 150 39
97 84 13 56 2 05 1 1 01 50 18 53
15
19 40 37 149 25 217 42 193 65 80 18 10 52 34 70 4 4 42 82
58 17 40 0 97 0 52 23 64 39
76
432 42 441 25 44 92 39
20 39
20 170 57
101 82
17 25 1 77 1 1 01 53
42 61 70 40     2018 2019
2020
2021
2022 Analysis
of of deviation of of 2022 vs 2021
over 20%:
1 Times interest interest earned decreased by 35% mainly due to increase in in in in in interest interest expenses 2 2 Return on Total Assets increased by 27% mainly due to increase increase in in in in in net income 3 3 Return on Equity attributable to to Shareholders of the Parent
increased by 34% mainly due to to increase increase in in in in in net income 4 Operating Income
to to Paid-in Capital Ratio increased by 73% mainly due to to increase increase in in in in in in in in operating income 5 Pre-tax Income
to to Paid-in Capital Ratio increased by 73% mainly due to to increase increase in in in in in in pre-tax income 6 Basic Earnings Earnings Per Per Share Share and Diluted Earnings Earnings Per Per Share Share increased by 70% mainly due to increase increase in in in in in in in net income 7 7 Cash Flow
Reinvestment Ratio increased by by 27% as as as as as a a a a a a a a a a result of increase increase in in in in in cash generated by by operating activities 123 * Glossary
1 1 Capital Structure Analysis
(1) Debt Ratio = Total Total Liabilities / Total Total Assets (2) Long-term Fund to Property Property Plant Plant and and Equipment Equipment Ratio Ratio = = (Shareholders’ Equity + Noncurrent
Liabilities) / Net Property Property Plant Plant and and Equipment Equipment 2 Liquidity Analysis
(1) Current Current Current Current Ratio Ratio = = Current Current Current Current Assets Assets / Current Current Current Current Liabilities (2) Quick Ratio Ratio = = = (Current Assets Assets - - Inventories - - Prepaid Expenses) / / / Current Current Current Current Current Liabilities Liabilities (3) Times Interest Interest Interest Earned = = Earnings before Interest Interest Interest and Taxes / / Interest Interest Interest Expenses
Expenses
3 Operating Performance Analysis
(1) Average Average Collection Turnover = Net Sales / Average Average Trade Receivables (including Accounts
4 Profitability Analysis
(1) Return on Total Total Assets Assets = (Net Income
+ Interest Expenses
* (1 (1 - Effective Tax
Rate)) / Average Total Total Assets (2) Return on Equity Equity Attributable Attributable Attributable to to to Shareholders Shareholders Shareholders of of of the the the Parent
Parent
Parent
= Net Income
Attributable Attributable Attributable to to to Shareholders Shareholders Shareholders of of of the the the Parent
Parent
Parent
/ / Average Equity Equity Attributable Attributable Attributable to to to Shareholders Shareholders Shareholders of of of the the the Parent
Parent
Parent
(3) Operating Operating Income
Income
Income
Income
to to to Paid-in Paid-in Paid-in Paid-in Capital Capital Capital Capital Ratio Ratio = = Operating Operating Income
Income
Income
Income
/ / / Paid-in Paid-in Paid-in Paid-in Capital Capital Capital Capital (4) Pre-tax Income
Income
Income
Income
Income
to to Paid-in Paid-in Paid-in Paid-in Capital Capital Capital Capital Ratio Ratio = = = Income
Income
Income
Income
Income
before Tax
/ / / Paid-in Paid-in Paid-in Paid-in Capital Capital Capital Capital (5) Net Net Net Net Margin = = Net Net Net Net Income
Income
Income
/ Net Net Net Net Sales (6) Earnings Per Share Share Share = = (Net Income
Income
Attributable to to Shareholders of of the Parent
- Preferred Stock Dividend) / Weighted Average Number of Shares Outstanding
5 Cash Cash Flow
Flow
(1) Cash Cash Cash Cash Cash Flow
Flow
Flow
Ratio Ratio = = Net Cash Cash Cash Cash Cash Provided by Operating Activities / / Current Liabilities (2) Cash Cash Cash Cash Cash Flow
Flow
Adequacy Ratio Ratio = = Five-year Five-year Sum Sum of of Cash Cash Cash Cash Cash from Operations
/ / Five-year Five-year Sum Sum of of Capital Expenditures Inventory Additions and Cash Cash Cash Cash Cash Dividend (3) Cash Cash Cash Cash Flow
Reinvestment Ratio = (Cash Provided by Operating Activities - - Cash Cash Cash Cash Dividends) / (Gross
Property Plant and Equipment + + + Long-term Investments + + + Other Noncurrent
Assets + + + Working Capital)
6 Leverage
(1) Operating Leverage
Leverage
Leverage
= = (Net Sales - - Variable Cost) / / Income
Income
Income
from from from Operations
Operations
Operations
(2) Financial Leverage
Leverage
= = Income
Income
Income
from from from Operations
Operations
Operations
/ / (Income from from from Operations
Operations
Operations
- - Interest Expenses) (2) (3) (4) (5) (6) (7)
Receivable Receivable Receivable and and Notes Receivable Receivable Receivable originated from operation)
Days Sales Sales Outstanding
= = 365 / / Average Average Average Collection Turnover Turnover Average Average Average Average Average Inventory Inventory Inventory Inventory Turnover Turnover Turnover Turnover = = = Cost of Sales Sales / / / Average Average Average Average Average Inventory Inventory Inventory Inventory Average Average Average Average Average Average Inventory Inventory Inventory Inventory Turnover Turnover Turnover Turnover Days = = = 365 / / / Average Average Average Average Average Average Inventory Inventory Inventory Inventory Turnover Turnover Turnover Turnover Average Average Average Average Payment Turnover Turnover Turnover = = Cost of Sales / / Average Average Average Average Trade Payables (including Accounts
Payable Payable Payable and and Notes Payable originated from operation)
Property Property Plant Plant and and and Equipment Equipment Turnover Turnover = = Net Net Net Sales Sales / / Average Average Net Net Net Property Property Plant Plant and and and Equipment Equipment Total Total Assets Assets Turnover Turnover = = Net Net Sales Sales / / Average Average Total Total Assets Assets 