
Page 91 - TSMC 2019 Annual Report
P. 91
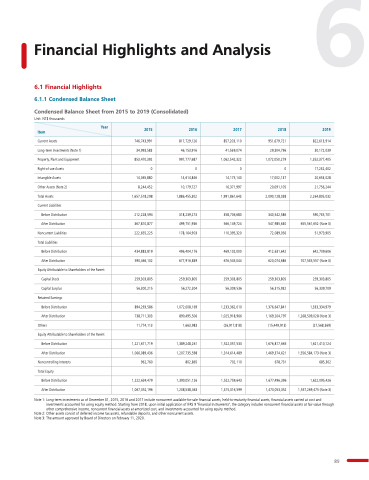
Financial Highlights and Analysis
822 613 914
30 172 039
1 352 377 405
17 232 402
20 653 028
21 756 244
2 2 2 264 805 032
590 735 701
655 561 652 (Note 3)
51 973 905
642 709 606
707 535 557 (Note 3)
259 303 805 56 339 709 1 333 334 979
1 268 509 028
(Note 3)
(27 568 369)
1 1 1 1 621 410 124
1 1 556 584 173 (Note 3)
685 302
1 622 095 426
1 557 269 475 (Note 3)
6
1 Financial Highlights 6
1 1 1 1 Condensed Balance Sheet
Condensed Balance Sheet
from 2015 to 2019 (Consolidated)
Unit: NT$ thousands
Current Assets
Long-term Investments (Note 1)
Property Plant and Equipment
746 743 991
34 993 583
853 470 392
0 14
065 880
8 244
452
1 1 657 518 298
212 228 594
367 810 877
222 655 225
434 883 819
590 466 102
259 303 805 56 300 215
894 293 586
738 711 303 11 11 774 113
1 1 1 1 221 671 719
1 066 089 436
962 760
1 222 634 479
1 1 067 052 196
817 729 126
46 153 916
997 777 687
0 14
14
614 846
10 179 727
1 886 455 302
318 239 273
499 751 936
178 164 903
496 404 176
677 916
839
259 303 805 56 272 304
1 1 072 008 169
890 495 506
1 663 983
1 1 389 248 261
1 207 735 598
802 865
1 1 1 390 051 126
1 208 538 463
857 203 110
41 569 074
1 062 542 322
0 14
14
175 140
16
371 997 1 1 1 991
861 643
358 706 680
566 149 724
110
395 320
469 102
000
676 545 044
259 303 805 56 309 536
1 1 233 362 010
1 1 025 918 966
(26 917 818)
1 522 057 533
1 1 1 314 614 489
702 110
1 522 759 643
1 1 1 315 316 599
951 679 721
29 304
796
1 072 050 279
0 17 002 137
20 091 105
2 2 090 128 038
340 542 586
547 985 630
72 089 056
412 631 642 620 074
686
259 303 805 56 315 932
1 1 376 647 841
1 1 169
204 797
(15 449 913)
1 1 676 817 665
1 1 469 374 621 678 731
1 677 496 396
1 470 053 352 Item
Year
2015 2016
2017
2018
2019 Right-of-use Assets
Intangible Assets
Other Assets
(Note 2)
Total Assets
Current Liabilities
Before Distribution
After Distribution
Noncurrent Liabilities
Total Liabilities
Before Distribution
After Distribution
Equity Attributable to Capital Stock
Capital Surplus
Retained Earnings
Before Distribution
After Distribution
Others
Equity Attributable to Before Distribution
After Distribution
Shareholders of the Parent
Shareholders of the Parent
Noncontrolling Interests
Total Equity Before Distribution
After Distribution
Note 1: Long-term investments as as as as of December 31 2015 2016
and and 2017
include noncurrent available-for-sale financial financial financial assets assets assets held-to-maturity financial financial financial assets assets assets financial financial financial assets assets assets carried at at cost and and investments accounted for using equity method Starting from 2018
upon initial application of IFRS 9 "Financial Instruments" the category includes noncurrent financial assets at at at fair value through other comprehensive income noncurrent financial assets at amortized cost and investments accounted for using equity method Note 2: Other assets assets assets consist of deferred income tax assets assets assets refundable deposits and other noncurrent assets assets assets Note 3: The amount approved by Board of Directors on February 11 2020 89 