
Page 355 - TSMC 2019 Annual Report
P. 355
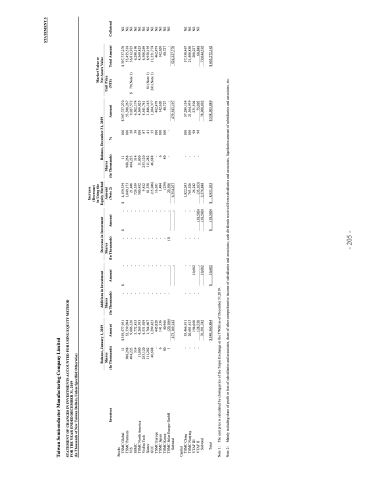
              Taiwan Semiconductor Manufacturing Company Limited
STATEMENT OF CHANGES IN INVESTMENTS ACCOUNTED FOR USING EQUITY METHOD FOR THE YEAR ENDED DECEMBER 31, 2019
(In Thousands of New Taiwan Dollars, Unless Specified Otherwise)
Stocks TSMC
$ 393,577,931 52,339,094 9,006,126 5,772,815 4,269,393 4,531,929 1,764,607 1,299,423 445,828 141,136 40,966
$
$
$
11 988,268 464,223 314 11,000 253,120 81,538 111,282 (15,046) 46,688 16,651 - 1,484 6 (239) 80
100 100 28 39 100 87 41 35 100 100 100 -
$ 397,737,270 53,388,267 9,027,572 6,502,174 4,569,825 4,541,741 1,846,145 1,284,377 462,479 142,620 40,727 - 479,543,197
$ 397,737,270 Nil 53,455,518 Nil 36,812,923 Nil
Subtotal
-
-
524,227,770
Capital
TSMC China TSMC Nanjing VTAF III VTAF II
1,822,243 763,526 26,242
100 100 98 98
57,289,154 21,364,939 231,504 75,095 78,960,692
57,358,467 Nil 21,408,850 Nil 208,227 Nil 68,848 Nil
Global Partners
-
-
-
-
TSMC
VIS
SSMC
TSMC
VisEra
Xintec
GUC
TSMC
TSMC
TSMC
TSMC Solar Europe GmbH
-
-
-
-
North America
-
-
-
-
Investees
Shares
(In Thousands)
Amount
Shares
(In Thousands)
Amount
Shares
(In Thousands)
Amount
Shares
(In Thousands) %
Amount
Unit Price (NT$)
Total Amount
Collateral
11 988,268 464,223 314 11,000 Tech 253,120 111,282 46,688 Europe - Japan 6 Korea 80
4,159,339 1,049,173 21,446 729,359 300,432 9,812
55,466,911 20,601,413 194,660 128,758 Subtotal 76,391,742
-
-
-
-
-
Total $ 549,560,884 Note 1: The unit price is calculated by closing price of the Taipei Exchange or the TWSE as Note 2: Mainly including share of profit or loss of subsidiaries and associates, share of other
$ 10,602
$ (18,500)
$
$ 558,503,889
Balance, January 1, 2019
Additions in Investment
Decrease in Investment
Increase (Decrease) in Using the Equity Method Amount (Note 2)
Balance, December 31, 2019
Market Value or Net Assets Value
1
(20,106) 473,169,142
-
-
(1)
-
20,106 6,354,257
-
-
-
-
-
-
-
-
-
-
10,602 - 10,602
-
-
-
-
-
- (18,500) (18,500)
(35,163) 2,576,848
-
-
-
-
-
$
79 (Note 1)
-
-
-
-
6,288,190 Nil 4,569,825 Nil 4,508,249 Nil 8,958,195 Nil
-
-
-
-
-
-
-
-
81 (Note 1) 241 (Note 1)
-
-
-
-
11,251,774 Nil 462,479 Nil 142,620 Nil
-
-
-
-
-
-
-
-
-
-
-
-
40,727 Nil - Nil
8,931,105
comprehensive income of subsidiaries and associates, cash dividends received from subsidiaries and associates, liquidation amount of subsidiaries and
79,044,392 $ 603,272,162
of December 31,2019.
- 205 -
associates, etc.
STATEMENT 5
