
Page 284 - TSMC 2019 Annual Report
P. 284
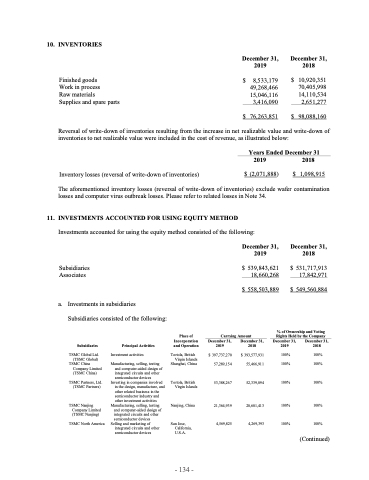
10. INVENTORIES
Finished goods
Work in process
Raw materials
Supplies and spare parts
$
8,533,179 49,268,466 15,046,116
December 31, 2019
December 31, 2018
$ 10,920,351 70,405,998 14,110,534 2,651,277
$ 98,088,160
3,416,090 $ 76,263,851
      Reversal of write-down of inventories resulting from the increase in net realizable value and write-down of inventories to net realizable value were included in the cost of revenue, as illustrated below:
Years Ended December 31 2019 2018
Inventory losses (reversal of write-down of inventories) $ (2,071,888) $ 1,098,915
The aforementioned inventory losses (reversal of write-down of inventories) exclude wafer contamination losses and computer virus outbreak losses. Please refer to related losses in Note 34.
      11. INVESTMENTS ACCOUNTED FOR USING EQUITY METHOD
Investments accounted for using the equity method consisted of the following:
Subsidiaries Associates
a. Investments in subsidiaries Subsidiaries consisted of the following:
December 31, 2019
$ 539,843,621 18,660,268
$ 558,503,889
December 31, 2018
$ 531,717,913 17,842,971
$ 549,560,884
      Place of Incorporation and Operation
Tortola, British Virgin Islands Shanghai, China
Tortola, British Virgin Islands
Nanjing, China
San Jose, California, U.S.A.
Carrying Amount
% of Ownership and Voting Rights Held by the Company
    Subsidiaries
TSMC Global Ltd. (TSMC Global)
TSMC China Company Limited (TSMC China)
TSMC Partners, Ltd. (TSMC Partners)
TSMC Nanjing Company Limited (TSMC Nanjing)
TSMC North America
Principal Activities
Investment activities
Manufacturing, selling, testing and computer-aided design of integrated circuits and other semiconductor devices
Investing in companies involved in the design, manufacture, and other related business in the semiconductor industry and other investment activities
Manufacturing, selling, testing and computer-aided design of integrated circuits and other semiconductor devices
Selling and marketing of integrated circuits and other semiconductor devices
December 31, 2019
$ 397,737,270 57,289,154
53,388,267
21,364,939 4,569,825
December 31, 2018
$ 393,577,931 55,466,911
52,339,094
20,601,413 4,269,393
December 31, 2019
100% 100%
100%
100% 100%
December 31, 2018
100% 100%
100%
100%
100% (Continued)
- 134 -
