
Page 260 - TSMC 2019 Annual Report
P. 260
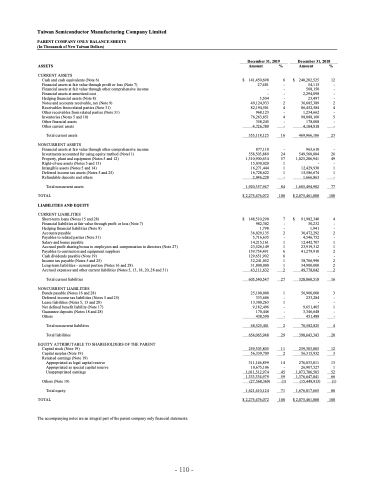
Taiwan Semiconductor Manufacturing Company Limited
PARENT COMPANY ONLY BALANCE SHEETS (In Thousands of New Taiwan Dollars)
ASSETS
CURRENT ASSETS
Cash and cash equivalents (Note 6)
Financial assets at fair value through profit or loss (Note 7) Financial assets at fair value through other comprehensive income Financial assets at amortized cost
Hedging financial assets (Note 8)
Notes and accounts receivable, net (Note 9)
Receivables from related parties (Note 31)
Other receivables from related parties (Note 31)
Inventories (Notes 5 and 10)
Other financial assets
Other current assets
Total current assets
NONCURRENT ASSETS
Financial assets at fair value through other comprehensive income Investments accounted for using equity method (Note11) Property, plant and equipment (Notes 5 and 12)
Right-of-use assets (Notes 5 and 13)
Intangible assets (Notes 5 and 14)
Deferred income tax assets (Notes 5 and 25)
Refundable deposits and others
Total noncurrent assets TOTAL
LIABILITIES AND EQUITY
CURRENT LIABILITIES
Short-term loans (Notes 15 and 28)
Financial liabilities at fair value through profit or loss (Note 7)
Hedging financial liabilities (Note 8)
Accounts payable
Payables to related parties (Note 31)
Salary and bonus payable
Accrued profit sharing bonus to employees and compensation to directors (Note 27) Payables to contractors and equipment suppliers
Cash dividends payable (Note 19)
Income tax payable (Notes 5 and 25)
Long-term liabilities - current portion (Notes 16 and 28)
Accrued expenses and other current liabilities (Notes 5, 13, 18, 20, 28 and 31)
Total current liabilities
NONCURRENT LIABILITIES
Bonds payable (Notes 16 and 28)
Deferred income tax liabilities (Notes 5 and 25) Lease liabilities (Notes 5, 13 and 28)
Net defined benefit liability (Note 17) Guarantee deposits (Notes 18 and 28)
Others
Total noncurrent liabilities
Total liabilities
EQUITY ATTRIBUTABLE TO SHAREHOLDERS OF THE PARENT Capital stock (Note 19)
Capital surplus (Note 19)
Retained earnings (Note 19)
Appropriated as legal capital reserve Appropriated as special capital reserve Unappropriated earnings
Others (Note 19) Total equity
TOTAL
The accompanying notes are an integral part of the parent company only financial statements.
December 31, 2019
December 31, 2018
   $
Amount
141,450,698 27,481 - - 3,504 49,124,933 82,194,501 968,123 76,263,851 358,245 4,726,789
355,118,125
877,110 558,503,889 1,310,900,634 15,030,020 16,271,444 16,728,622 2,046,228
1,920,357,947 2,275,476,072
148,510,290 982,302 1,798 36,029,135 5,716,635 14,215,161 23,526,149 139,754,491 129,651,902 32,241,052 31,800,000 43,111,632
605,540,547
25,100,000 333,606 13,300,263 9,182,496 170,446 438,590
48,525,401 654,065,948
259,303,805 56,339,709
311,146,899 10,675,106 1,011,512,974 1,333,334,979
(27,568,369) 1,621,410,124 2,275,476,072
%
6 - - - - 2 4 - 4 - -
16
-
24 57 1 1 1 -
84 100
7 - - 2 - 1 1 6 6 1 1 2
27
1 - 1 - - -
2 29
11 2
14 - 45 59
(1) 71 100
Amount
$ 240,202,525 54,115 568,150 2,294,098 23,497 36,685,389 86,452,584 1,234,662 98,088,160 178,008 4,184,918
469,966,106
963,610 549,560,884 1,025,286,941 - 12,429,930 15,586,674 1,666,863
1,605,494,902 2,075,461,008
91,982,340 30,232 1,941 30,472,292 4,546,752 12,442,707 23,919,312 41,279,910 - 38,706,990 34,900,000 49,778,042
328,060,518
56,900,000 233,284 - 9,651,405 3,346,648 451,488
70,582,825 398,643,343
259,303,805 56,315,932
276,033,811 26,907,527 1,073,706,503 1,376,647,841
(15,449,913) 1,676,817,665 2,075,461,008
%
12 - - - - 2 4 - 5 - -
23
-
26 49 - 1 1 -
77 100
4 - - 2 - 1 1 2 - 2 2 2
16
3 - - 1 - -
4 20
12 3
13 1 52 66 (1)
80 100
        $
$
$
$
                          $
$
    - 110 -
