
Page 210 - TSMC 2019 Annual Report
P. 210
respectively. There is no significant difference between the aforementioned approved amounts and the amounts charged against earnings of 2019, 2018 and 2017, respectively.
The information about the appropriations of TSMC’s profit sharing bonus to employees and compensation to directors is available at the Market Observation Post System website.
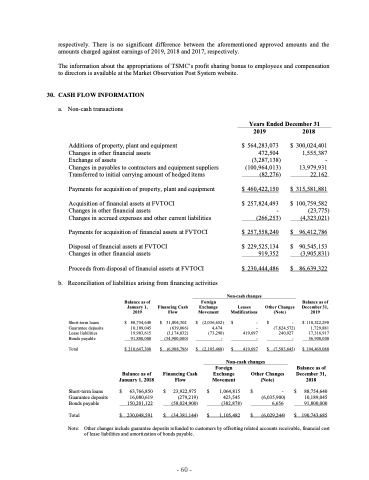
30. CASH FLOW INFORMATION
a. Non-cash transactions
Additions of property, plant and equipment
Changes in other financial assets
Exchange of assets
Changes in payables to contractors and equipment suppliers Transferred to initial carrying amount of hedged items
Payments for acquisition of property, plant and equipment
Acquisition of financial assets at FVTOCI
Changes in other financial assets
Changes in accrued expenses and other current liabilities
Payments for acquisition of financial assets at FVTOCI
Disposal of financial assets at FVTOCI Changes in other financial assets
Proceeds from disposal of financial assets at FVTOCI
b. Reconciliation of liabilities arising from financing activities
Years Ended December 31
2019
$ 564,283,073 472,504
(3,287,138) (100,964,013) (82,276)
$ 460,422,150
$ 257,824,493 -
(266,253) $ 257,558,240
$ 229,525,134 919,352
$ 230,444,486
$
$ $
$ $
$
2018
300,024,401 1,555,387 - 13,979,931 22,162
315,581,881
100,759,582 (23,775) (4,323,021)
96,412,786
90,545,153 (3,905,831)
86,639,322
Balance as of December 31, 2019
$ 118,522,290 1,729,881 17,316,917 56,900,000
$ 194,469,088
Balance as of December 31, 2018
Balance as of January 1, 2019
Financing Cash Flow
$ 31,804,302 (639,066) (3,174,032) (34,900,000)
$ (6,908,796)
Foreign Exchange Movement
(2,036,652) 4,474
(73,290) -
(2,105,468)
Non-cash changes
Leases Modifications
Other Changes (Note)
Short-term loans Guarantee deposits Lease liabilities Bonds payable
Total
Short-term loans Guarantee deposits Bonds payable
Total
$
88,754,640 10,189,045 19,903,615 91,800,000
$
$
$
$
-
-
419,697 -
419,697
$
$
-
(7,824,572) 240,927 -
(7,583,645)
$ 210,647,300
Balance as of Financing Cash January 1, 2018 Flow
Foreign Exchange Movement
1,064,815 423,545
(382,878) 1,105,482
Other Changes (Note)
$
63,766,850 $ 23,922,975
16,080,619 (279,219) 150,201,122 (58,024,900)
$
$
$
$
-
(6,035,900) 6,656
(6,029,244)
$
$
88,754,640 10,189,045 91,800,000
190,743,685
Non-cash changes
$ 230,048,591 $ (34,381,144)
Note: Other changes include guarantee deposits refunded to customers by offsetting related accounts receivable, financial cost of lease liabilities and amortization of bonds payable.
- 60 -
