
Page 201 - TSMC 2019 Annual Report
P. 201
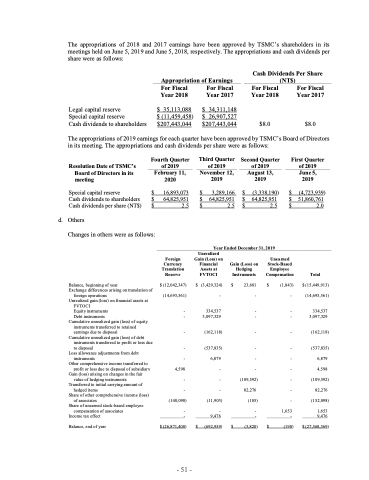
The appropriations of 2018 and 2017 earnings have been approved by TSMC’s shareholders in its meetings held on June 5, 2019 and June 5, 2018, respectively. The appropriations and cash dividends per share were as follows:
Appropriation of Earnings
Cash Dividends Per Share
For Fiscal Year 2018
$ 35,113,088 $ (11,459,458) $207,443,044
For Fiscal Year 2017
$ 34,311,148 $ 26,907,527 $207,443,044
For Fiscal Year 2018
$8.0
(NT$)
For Fiscal Year 2017
$8.0
    Legal capital reserve
Special capital reserve
Cash dividends to shareholders
            The appropriations of 2019 earnings for each quarter have been approved by TSMC’s Board of Directors in its meeting. The appropriations and cash dividends per share were as follows:
Resolution Date of TSMC’s
Board of Directors in its meeting
Special capital reserve
Cash dividends to shareholders Cash dividends per share (NT$)
Fourth Quarter of 2019 February 11, 2020
Third Quarter Second Quarter of 2019 of 2019
November 12, August 13, 2019 2019
First Quarter of 2019 June 5, 2019
    $ $ $
16,893,073 64,825,951 2.5
Foreign Currency Translation Reserve
$ (12,042,347) (14,693,561)
-
-
-
-
-
4,598 - -
(140,090)
-
-
$ (26,871,400)
$ $ $
3,289,166 $ (3,338,190) $ 64,825,951 $ 64,825,951 $
(4,723,939) 51,860,761 2.0
Total
            2.5 $
2.5 $
31, 2019
Unearned Stock-Based Employee Compensation
            d. Others
Changes in others were as follows:
Balance, beginning of year
Exchange differences arising on translation of
foreign operations
Unrealized gain (loss) on financial assets at
FVTOCI
Equity instruments Debt instruments
Cumulative unrealized gain (loss) of equity instruments transferred to retained earnings due to disposal
Cumulative unrealized gain (loss) of debt instruments transferred to profit or loss due to disposal
Loss allowance adjustments from debt instruments
Other comprehensive income transferred to profit or loss due to disposal of subsidiary
Gain (loss) arising on changes in the fair value of hedging instruments
Transferred to initial carrying amount of hedged items
Share of other comprehensive income (loss) of associates
Share of unearned stock-based employee compensation of associates
Income tax effect Balance, end of year
Year Ended December Unrealized
     Gain (Loss) on Financial Assets at FVTOCI
Gain (Loss) on Hedging Instruments
$
(3,429,324) -
334,537 3,097,329
(162,118)
(537,835) 6,879 -
$
23,601 -
-
-
-
-
-
-
$
(1,843) $ (15,449,913) - (14,693,561)
- 334,537 - 3,097,329
- (162,118)
- (537,835) - 6,879 - 4,598 - (109,592) - 82,276 - (152,098)
1,653 1,653 - 9,476
(190) $ (27,568,369)
    $
-
(11,903)
-
9,476 (692,959)
$
82,276 (105)
-
-
(3,820)
$
- (109,592)
           - 51 -
