
Page 369 - TSMC 2018 Annual Report
P. 369
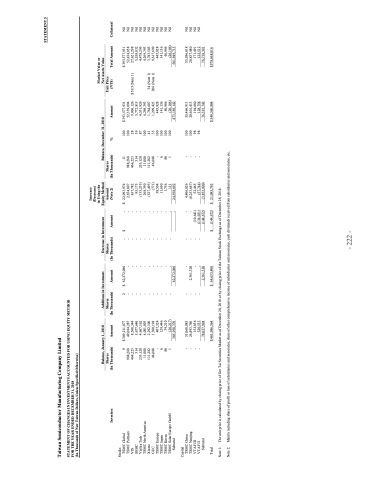
                                                              Taiwan Semiconductor Manufacturing Company Limited
STATEMENT OF CHANGES IN INVESTMENTS ACCOUNTED FOR USING EQUITY METHOD FOR THE YEAR ENDED DECEMBER 31, 2018
(In Thousands of New Taiwan Dollars, Unless Specified Otherwise)
Stocks TSMC
9 988,268 464,223 314 Tech 253,120
$ 309,211,877 49,684,287 8,568,344 5,677,640 4,667,162 4,001,003 2,292,100 1,300,194 407,324 129,446 39,210
2 - - - - - - - - - - -
$ 62,272,080 - - - - - - - - - - - 62,272,080
- - - - - - - - - - - -
$
- $ 22,093,974 - 2,654,807 - 437,782 - 95,175 - (135,233) - 268,390 - (527,493) - (771) - 38,504 - 11,690 - 1,756 - 111 - 24,938,692
11 988,268 464,223 314 253,120 11,000 111,282 46,688 - 6 80 1
100 100 28 39 87 100 41 35 100 100 100 100
$ 393,577,931 52,339,094 9,006,126 5,772,815 4,531,929 4,269,393 1,764,607 1,299,423 445,828 141,136 40,966
$ 393,577,931 Nil 52,434,858 Nil 27,621,298 Nil
Note 1: Note 2:
$ 64,633,400
Mainly including share of profit or loss of subsidiaries and associates, share of other comprehensive income of subsidiaries and associates, cash dividends received from subsidiaries and associates, etc.
Subtotal
501,949,715
Capital
TSMC China TSMC Nanjing VTAF III VTAF II
- - - -
51,060,885 26,493,740 152,836 320,533 78,027,994
- - - -
- 2,361,320 - - 2,361,320
- - - -
- 4,406,026
- - - -
100 100 98 98
55,466,911 20,601,413 194,660 128,758 76,391,742
55,586,818 Nil 20,837,480 Nil 171,491 Nil 122,512 Nil
Subtotal Total
(144,672) (3,852,900)
76,718,301 $578,668,016
Global Partners
TSMC
VIS
SSMC
VisEra
TSMC
Xintec
GUC
TSMC
TSMC
TSMC
TSMC Solar Europe GmbH
$ 59.5 (Note 1)
5,558,832 Nil 4,478,295 Nil 4,269,393 Nil 3,783,585 Nil 9,617,699 Nil
Investees
Shares
(In Thousands)
Amount
Shares
(In Thousands)
Amount
Shares
(In Thousands)
Amount (Note 2)
Shares
(In Thousands) %
Amount
Unit Price (NT$)
Total Amount
Collateral
11,000 111,282 46,688 Europe - Japan 6 Korea 80 1
North America
34 (Note 1) 206 (Note 1)
The unit price is calculated by closing price of Gre Tai Securities
Balance, January 1, 2018
Additions in Investment
Decrease in Investment
Increase (Decrease) in Using the Equity Method Amount
Balance, December 31, 2018
Market Value or Net Assets Value
(20,217) 385,958,370
(20,106) 473,169,142
445,828 Nil 141,136 Nil 40,966 Nil (20,106) Nil
$ 463,986,364
Market as of December 28, 2018 or by closing price of the Taiwan Stock Exchange as of December 28, 2018.
- 222 -
$
- (8,253,647) (10,641) 52,465 (134,031) (57,744)
(144,672) $ 21,085,792
$ 549,560,884
STATEMENT 5
