
Page 353 - TSMC 2018 Annual Report
P. 353
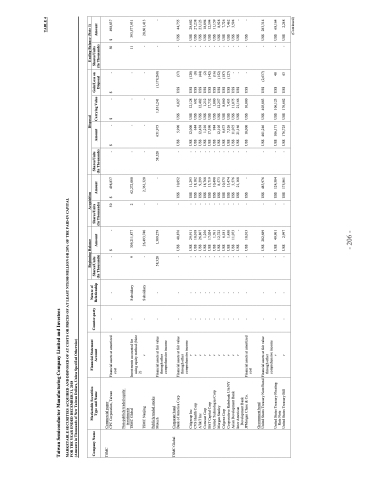
                                                                                                                                                                                                                                                                                                                                                                                                                                                                                                                                                                                             Taiwan Semiconductor Manufacturing Company Limited and Investees
MARKETABLE SECURITIES ACQUIRED AND DISPOSED OF AT COSTS OR PRICES OF AT LEAST NT$300 MILLION OR 20% OF THE PAID-IN CAPITAL FOR THE YEAR ENDED DECEMBER 31, 2018
(Amounts in Thousands of New Taiwan Dollars, Unless Specified Otherwise)
Company Name
Marketable Securities Type and Name
Financial Statement Account
Nature of Counter-party Relationship
Beginning Balance
Acquisition Shares/Units Amount
Disposal
Amount Carrying Value
Ending Balance (Note 1) Shares/Units Amount
TSMC
Commercial paper
CPC Corporation, Taiwan
Financial assets at amortized cost
- --
$- 50 $ 498,837
-
$- $-
$-50 $ 498,837
TSMC Global
Corporate bond
Bank of America Corp
Financial assets at fair value through other comprehensive income
- -
-
US$ 40,876 - US$ 10,852
-
US$ 5,990 US$ 6,027 US$ (37)
- US$ 44,755
Non-publicly traded equity investments
- Subsidiary 9 - Subsidiary -
309,211,877 2 62,272,080 26,493,740 - 2,361,320 1,309,279 - -
-
- -
-11 393,577,931
TSMC Global
Investments accounted for using equity method (Note 2)
TSMC Nanjing
〃
- 58,320
- - - 651,973 1,831,241 (1,179,268)
- 20,601,413 - -
Publicly traded stocks Motech
Financial assets at fair value through other comprehensive income
- -
58,320
Citigroup Inc
CVS Health Corp
AT&T Inc
Comcast Corp
BAT Capital Corp
United Technologies Corp Morgan Stanley
Celgene Corp
Cooperatieve Rabobank UA/NY Asian Development Bank
Inter American
〃 〃 〃 〃 〃 〃 〃 〃 〃 〃 〃
- - - - - - - - - - - - - - - - - - - - - -
- - - - - - - - - - -
US$ 29,911 - US$ 11,293 US$ 10,018 - US$ 18,102 US$ 26,867 - US$ 9,299 US$ 1,256 - US$ 18,768 US$ 17,024 - US$ 13,719 US$ 1,761 - US$ 10,490 US$ 12,722 - US$ 8,573 US$ 6,181 - US$ 10,575 US$ 1,450 - US$ 13,474 US$ 11,073 - US$ 3,576 US$ - - US$ 21,168
- - - - - - - - - - -
US$ 12,000 US$ 12,128 US$ (128) US$ 684 US$ 692 US$ (8) US$ 12,438 US$ 12,482 US$ (44) US$ 1,210 US$ 1,212 US$ (2) US$ 17,590 US$ 17,732 US$ (142) US$ 984 US$ 1,000 US$ (16) US$ 12,105 US$ 12,257 US$ (152) US$ 8,673 US$ 8,860 US$ (187) US$ 7,326 US$ 7,453 US$ (127) US$ 11,075 US$ 11,075 US$ - US$ 21,166 US$ 21,166 US$ -
- US$ 28,602 - US$ 27,238 - US$ 23,123 - US$ 18,894 - US$ 12,594 - US$ 11,159 - US$ 8,928 - US$ 7,726 - US$ 7,462 - US$ 3,594 - US$ -
Development Bank JPMorgan Chase & Co.
Financial assets at amortized cost
- -
-
US$ 10,013 - US$ -
-
US$ 10,000 US$ 10,000 US$ -
- US$ -
Government bond
United States Treasury Note/Bond
Financial assets at fair value through other comprehensive income
- -
-
US$ 202,689 - US$ 483,976
-
US$ 401,246 US$ 403,883 US$ (2,637)
- US$ 283,314
United States Treasury Floating Rate Note
〃 〃
- - - -
- -
US$ 49,901 - US$ 124,504 US$ 2,997 - US$ 175,861
- -
US$ 106,171 US$ 106,123 US$ 48 US$ 176,725 US$ 176,682 US$ 43
- US$ 68,164 - US$ 2,248
United States Treasury Bill
Shares/Units (In Thousands)
Amount
(In Thousands)
Shares/Units (In Thousands)
Gain/Loss on Disposal
(In Thousands)
- 206 -
TABLE 4
(Continued)
