
Page 321 - TSMC 2018 Annual Report
P. 321
aforementioned approved amounts and the amounts charged against earnings of 2018, 2017 and 2016, respectively.
The information about the appropriations of the Company’s profit sharing bonus to employees and compensation to directors is available at the Market Observation Post System website.
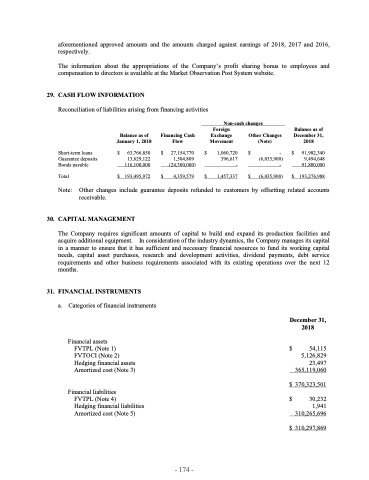
29. CASH FLOW INFORMATION
Reconciliation of liabilities arising from financing activities
Non-cash changes
Short-term loans Guarantee deposits Bonds payable
Total
$
$
27,154,770 1,504,809
(24,300,000) 4,359,579
$
$
$
$
- (6,035,900)
- (6,035,900)
$
$
91,982,340 9,494,648 91,800,000
193,276,988
Balance as of January 1, 2018
$ 63,766,850 13,629,122 116,100,000
$ 193,495,972
Financing Cash Flow
Foreign Exchange Movement
1,060,720 396,617 -
1,457,337
Other Changes (Note)
Balance as of December 31, 2018
Note: Other changes include guarantee deposits refunded to customers by offsetting related accounts receivable.
30. CAPITALMANAGEMENT
The Company requires significant amounts of capital to build and expand its production facilities and acquire additional equipment. In consideration of the industry dynamics, the Company manages its capital in a manner to ensure that it has sufficient and necessary financial resources to fund its working capital needs, capital asset purchases, research and development activities, dividend payments, debt service requirements and other business requirements associated with its existing operations over the next 12 months.
31. FINANCIALINSTRUMENTS
a. Categories of financial instruments
Financial assets
FVTPL (Note 1) FVTOCI (Note 2) Hedging financial assets Amortized cost (Note 3)
Financial liabilities
FVTPL (Note 4)
Hedging financial liabilities Amortized cost (Note 5)
December 31, 2018
$ 54,115 5,126,829 23,497 365,119,060
$ 370,323,501
$ 30,232 1,941 310,265,696
$ 310,297,869
- 174 -
