
Page 268 - TSMC 2018 Annual Report
P. 268
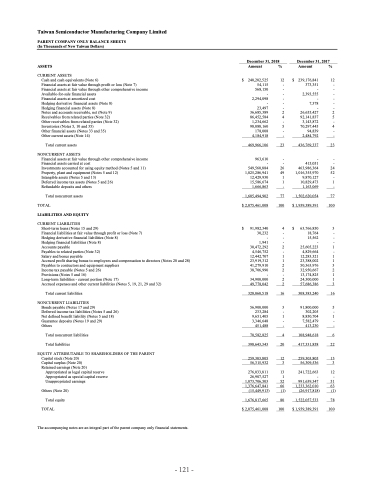
 Taiwan Semiconductor Manufacturing Company Limited
PARENT COMPANY ONLY BALANCE SHEETS (In Thousands of New Taiwan Dollars)
ASSETS
CURRENT ASSETS
Cash and cash equivalents (Note 6)
Financial assets at fair value through profit or loss (Note 7) Financial assets at fair value through other comprehensive income Available-for-sale financial assets
Financial assets at amortized cost
Hedging derivative financial assets (Note 8)
Hedging financial assets (Note 8)
Notes and accounts receivable, net (Note 9)
Receivables from related parties (Note 32)
Other receivables from related parties (Note 32)
Inventories (Notes 5, 10 and 35)
Other financial assets (Notes 33 and 35)
Other current assets (Note 14)
Total current assets
NONCURRENT ASSETS
Financial assets at fair value through other comprehensive income Financial assets carried at cost
Investments accounted for using equity method (Notes 5 and 11) Property, plant and equipment (Notes 5 and 12)
Intangible assets (Notes 5 and 13)
Deferred income tax assets (Notes 5 and 26)
Refundable deposits and others
Total noncurrent assets TOTAL
LIABILITIES AND EQUITY
CURRENT LIABILITIES
Short-term loans (Notes 15 and 29)
Financial liabilities at fair value through profit or loss (Note 7)
Hedging derivative financial liabilities (Note 8)
Hedging financial liabilities (Note 8)
Accounts payable
Payables to related parties (Note 32)
Salary and bonus payable
Accrued profit sharing bonus to employees and compensation to directors (Notes 20 and 28) Payables to contractors and equipment suppliers
Income tax payable (Notes 5 and 26)
Provisions (Notes 5 and 16)
Long-term liabilities - current portion (Note 17)
Accrued expenses and other current liabilities (Notes 5, 19, 21, 29 and 32)
Total current liabilities
NONCURRENT LIABILITIES
Bonds payable (Notes 17 and 29)
Deferred income tax liabilities (Notes 5 and 26) Net defined benefit liability (Notes 5 and 18) Guarantee deposits (Notes 19 and 29)
Others
Total noncurrent liabilities
Total liabilities
EQUITY ATTRIBUTABLE TO SHAREHOLDERS OF THE PARENT Capital stock (Note 20)
Capital surplus (Note 20)
Retained earnings (Note 20)
Appropriated as legal capital reserve Appropriated as special capital reserve Unappropriated earnings
Others (Note 20) Total equity
TOTAL
The accompanying notes are an integral part of the parent company only financial statements.
December 31, 2018
December 31, 2017
      $
Amount
240,202,525 54,115 568,150 - 2,294,098 - 23,497 36,685,389 86,452,584 1,234,662 98,088,160 178,008 4,184,918
469,966,106
963,610 - 549,560,884 1,025,286,941 12,429,930 15,586,674 1,666,863
1,605,494,902 2,075,461,008
91,982,340 30,232 - 1,941 30,472,292 4,546,752 12,442,707 23,919,312 41,279,910 38,706,990 - 34,900,000 49,778,042
328,060,518
56,900,000 233,284 9,651,405 3,346,648 451,488
70,582,825 398,643,343
259,303,805 56,315,932
276,033,811 26,907,527 1,073,706,503 1,376,647,841
(15,449,913) 1,676,817,665 2,075,461,008
%
12 - - - - - - 2 4 - 5 - -
23
-
- 26 49 1 1 -
77 100
4 - - - 2 - 1 1 2 2 - 2 2
16
3 - 1 - -
4 20
12 3
13 1 52 66 (1)
80 100
Amount
$ 239,176,841 373,351 - 2,393,555 - 7,378 - 26,655,427 92,141,837 3,143,872 70,297,445 94,839 2,484,792
436,769,337
- 415,051 463,986,364 1,016,355,970 9,870,127 10,829,473 1,163,069
1,502,620,054 1,939,389,391
63,766,850 18,764 15,562 - 25,605,223 4,829,664 12,283,321 23,388,002 50,363,976 32,950,667 13,174,825 24,300,000 57,686,386
308,383,240
91,800,000 302,205 8,850,704 7,582,479 413,230
108,948,618 417,331,858
259,303,805 56,309,536
241,722,663 - 991,639,347 1,233,362,010
(26,917,818) 1,522,057,533 1,939,389,391
%
12 - - - - - - 2 5 - 4 - -
23
-
- 24 52 - 1 -
77 100
3 - - - 1 - 1 1 3 2 1 1 3
16
5 - 1 - -
6 22
13 3
12 - 51 63
(1) 78 100
                $
$
$
$
                                                    $
$
        - 121 -
