
Page 250 - TSMC 2018 Annual Report
P. 250
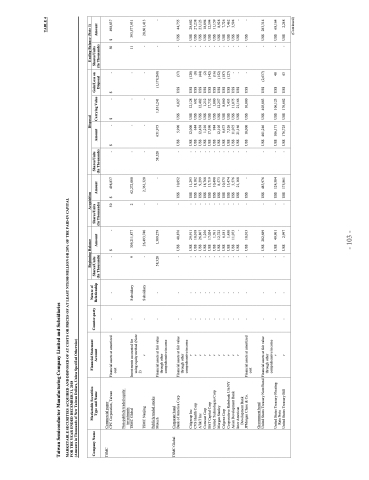
                                                                                                                                                                                                                                                                                                                                                                                                                                                                                                                                                                                             Taiwan Semiconductor Manufacturing Company Limited and Subsidiaries
MARKETABLE SECURITIES ACQUIRED AND DISPOSED OF AT COSTS OR PRICES OF AT LEAST NT$300 MILLION OR 20% OF THE PAID-IN CAPITAL FOR THE YEAR ENDED DECEMBER 31, 2018
(Amounts in Thousands of New Taiwan Dollars, Unless Specified Otherwise)
Company Name
Marketable Securities Type and Name
Financial Statement
Account Counter-party
Nature of Relationship
Beginning Balance
Acquisition Shares/Units Amount
Disposal
Amount Carrying Value
Ending Balance (Note 1) Shares/Units Amount
TSMC
Commercial paper
CPC Corporation, Taiwan
Financial assets at amortized - cost
--
$- 50 $ 498,837
-
$- $-
$-50 $ 498,837
TSMC Global
Corporate bond
Bank of America Corp
Financial assets at fair value - - through other
comprehensive income
-
US$ 40,876 - US$ 10,852
-
US$ 5,990 US$ 6,027 US$ (37)
- US$ 44,755
Non-publicly traded equity investments
Investments accounted for - using equity method (Note
Subsidiary 9 Subsidiary -
309,211,877 2 62,272,080 26,493,740 - 2,361,320 1,309,279 - -
-
- -
-11 393,577,931
TSMC Global
TSMC Nanjing
2)
〃 -
- 58,320
- - - 651,973 1,831,241 (1,179,268)
- 20,601,413 - -
Publicly traded stocks Motech
Financial assets at fair value - - through other
comprehensive income
58,320
Citigroup Inc
CVS Health Corp
AT&T Inc
Comcast Corp
BAT Capital Corp
United Technologies Corp Morgan Stanley
Celgene Corp
Cooperatieve Rabobank UA/NY Asian Development Bank
Inter American
〃 - - 〃 - - 〃 - - 〃 - - 〃 - - 〃 - - 〃 - - 〃 - - 〃 - - 〃 - - 〃 - -
- - - - - - - - - - -
US$ 29,911 - US$ 11,293 US$ 10,018 - US$ 18,102 US$ 26,867 - US$ 9,299 US$ 1,256 - US$ 18,768 US$ 17,024 - US$ 13,719 US$ 1,761 - US$ 10,490 US$ 12,722 - US$ 8,573 US$ 6,181 - US$ 10,575 US$ 1,450 - US$ 13,474 US$ 11,073 - US$ 3,576 US$ - - US$ 21,168
- - - - - - - - - - -
US$ 12,000 US$ 12,128 US$ (128) US$ 684 US$ 692 US$ (8) US$ 12,438 US$ 12,482 US$ (44) US$ 1,210 US$ 1,212 US$ (2) US$ 17,590 US$ 17,732 US$ (142) US$ 984 US$ 1,000 US$ (16) US$ 12,105 US$ 12,257 US$ (152) US$ 8,673 US$ 8,860 US$ (187) US$ 7,326 US$ 7,453 US$ (127) US$ 11,075 US$ 11,075 US$ - US$ 21,166 US$ 21,166 US$ -
- US$ 28,602 - US$ 27,238 - US$ 23,123 - US$ 18,894 - US$ 12,594 - US$ 11,159 - US$ 8,928 - US$ 7,726 - US$ 7,462 - US$ 3,594 - US$ -
Development Bank JPMorgan Chase & Co.
Financial assets at amortized - - cost
-
US$ 10,013 - US$ -
-
US$ 10,000 US$ 10,000 US$ -
- US$ -
Government bond
United States Treasury Note/Bond
Financial assets at fair value - - through other
comprehensive income
-
US$ 202,689 - US$ 483,976
-
US$ 401,246 US$ 403,883 US$ (2,637)
- US$ 283,314
United States Treasury Floating Rate Note
〃 - - 〃 - -
- -
US$ 49,901 - US$ 124,504 US$ 2,997 - US$ 175,861
- -
US$ 106,171 US$ 106,123 US$ 48 US$ 176,725 US$ 176,682 US$ 43
- US$ 68,164 - US$ 2,248
United States Treasury Bill
Shares/Units (In Thousands)
Amount
(In Thousands)
Shares/Units (In Thousands)
Gain/Loss on Disposal
(In Thousands)
- 103 -
TABLE 4
(Continued)
