
Page 233 - TSMC 2018 Annual Report
P. 233
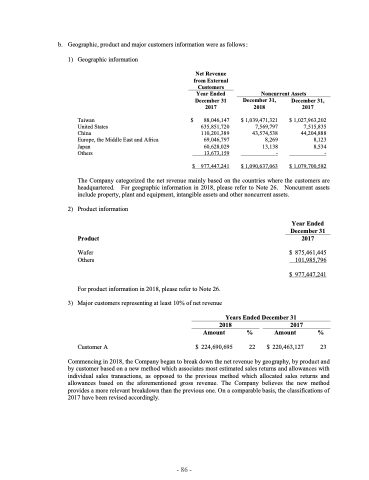
 b. Geographic, product and major customers information were as follows: 1) Geographic information
Net Revenue from External Customers Year Ended December 31 2017
Noncurrent Assets
    Taiwan
United States
China 110,201,389 Europe, the Middle East and Africa 69,046,797 Japan 60,628,029 Others 13,673,159
$ 977,447,241
December 31, 2018
$ 1,039,471,321 7,569,797 43,574,538 8,269 13,138 -
$ 1,090,637,063
December 31, 2017
$ 1,027,963,202 7,515,835 44,204,888 8,123 8,534 -
$ 1,079,700,582
$ 88,046,147 635,851,720
         The Company categorized the net revenue mainly based on the countries where the customers are headquartered. For geographic information in 2018, please refer to Note 26. Noncurrent assets include property, plant and equipment, intangible assets and other noncurrent assets.
2) Product information
Product
Wafer Others
For product information in 2018, please refer to Note 26.
3) Major customers representing at least 10% of net revenue
Year Ended December 31 2017
$ 875,461,445 101,985,796
$ 977,447,241
    Years Ended December 31 2018 2017
Amount       % Amount %
Customer A $ 224,690,695 22 $ 220,463,127 23
Commencing in 2018, the Company began to break down the net revenue by geography, by product and by customer based on a new method which associates most estimated sales returns and allowances with individual sales transactions, as opposed to the previous method which allocated sales returns and allowances based on the aforementioned gross revenue. The Company believes the new method provides a more relevant breakdown than the previous one. On a comparable basis, the classifications of 2017 have been revised accordingly.
         - 86 -
