
Page 213 - TSMC 2018 Annual Report
P. 213
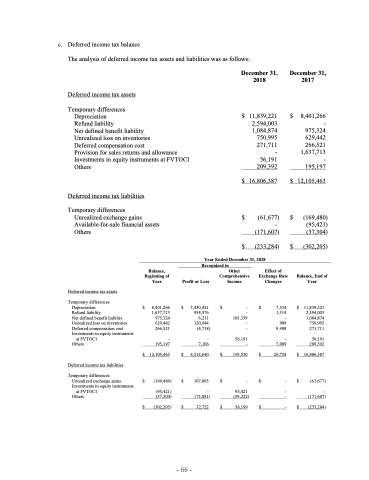
 c. Deferred income tax balance
The analysis of deferred income tax assets and liabilities was as follows:
December 31, 2018
Deferred income tax assets
Temporary differences
Depreciation
Refund liability
Net defined benefit liability
Unrealized loss on inventories
Deferred compensation cost
Provision for sales returns and allowance
Investments in equity instruments at FVTOCI
Others 209,392
December 31, 2017
$ 8,401,266 - 975,324 629,442 266,521 1,637,713 - 195,197
$ 12,105,463
 $ 11,839,221 2,594,003 1,084,874 750,995 271,711 - 56,191
  $ 16,806,387
    Deferred income tax liabilities
Temporary differences
Unrealized exchange gains Available-for-sale financial assets Others
$ $
(61,677) -
(171,607) (233,284)
$ $
(169,480) (95,421) (37,304)
(302,205)
Balance, End of Year
$ 11,839,221 2,594,003 1,084,874 750,995 271,711
56,191 209,392
$ 16,806,387
$ (61,677)
- (171,607)
$ (233,284)
                 Balance, Beginning of Year
Year Ended December 31, 2018 Recognized in
   Deferred income tax assets
Temporary differences Depreciation
Refund liability
Net defined benefit liability Unrealized loss on inventories Deferred compensation cost Investments in equity instruments
$
8,401,266 1,637,713 975,324 629,442 266,521
$
$
$
3,430,421 954,976 6,211 120,644
(4,718)
- 7,106
4,514,640
107,803
$
$
$
Income Changes
- $ 7,534
- 1,314 103,339 - - 909 - 9,908
56,191 - - 7,089
159,530 $ 26,754
- $-
Profit or Loss
Other Effect of Comprehensive Exchange Rate
 at FVTOCI
Others 195,197
- $ 12,105,463
$ (169,480)
               Deferred income tax liabilities
Temporary differences
Unrealized exchange gains Investments in equity instruments
at FVTOCI Others
-
$ (302,205) $ 32,722 $ 36,199 $ -
 (95,421)
(37,304) (75,081) (59,222) -
95,421 -
               - 66 -
