
Page 208 - TSMC 2018 Annual Report
P. 208
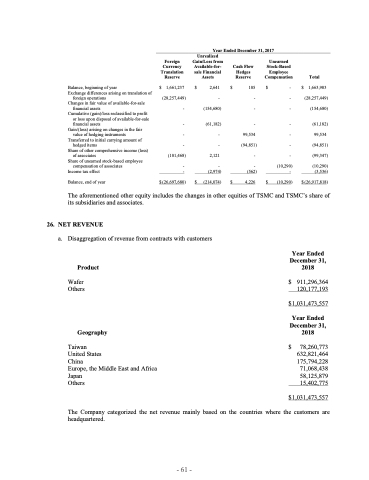
 Year Ended December 31, 2017
            Balance, beginning of year
Exchange differences arising on translation of
foreign operations
Changes in fair value of available-for-sale
financial assets
Cumulative (gain)/loss reclassified to profit
or loss upon disposal of available-for-sale
financial assets
Gain/(loss) arising on changes in the fair
value of hedging instruments Transferred to initial carrying amount of
hedged items
Share of other comprehensive income (loss)
of associates
Share of unearned stock-based employee
compensation of associates Income tax effect
Balance, end of year
$
1,661,237 (28,257,449)
-
- - -
(101,468)
- -
$
2,641 -
(154,680)
(61,182) -
-
2,121
- (2,974)
(214,074)
$
$
- $ 1,663,983 - (28,257,449) - (154,680)
- (61,182) - 99,534 - (94,851) - (99,347)
(10,290) (10,290) - (3,536)
(10,290) $ (26,917,818)
Foreign Currency Translation Reserve
Unrealized Gain/Loss from Available-for- sale Financial Assets
Cash Flow Hedges Reserve
105 - -
- 99,534
(94,851) -
- (562)
4,226
Unearned Stock-Based Employee Compensation
Total
     $ (26,697,680)
$
$
$
          The aforementioned other equity includes the changes in other equities of TSMC and TSMC’s share of its subsidiaries and associates.
26. NET REVENUE
a. Disaggregation of revenue from contracts with customers
Product
Wafer Others
Geography
Taiwan
United States
China
Europe, the Middle East and Africa Japan
Others
Year Ended December 31, 2018
$ 911,296,364 120,177,193
$ 1,031,473,557
Year Ended December 31, 2018
   $
78,260,773 632,821,464 175,794,228
71,068,438 58,125,879 15,402,775
 $ 1,031,473,557
  The Company categorized the net revenue mainly based on the countries where the customers are headquartered.
- 61 -
