
Page 160 - TSMC 2018 Annual Report
P. 160
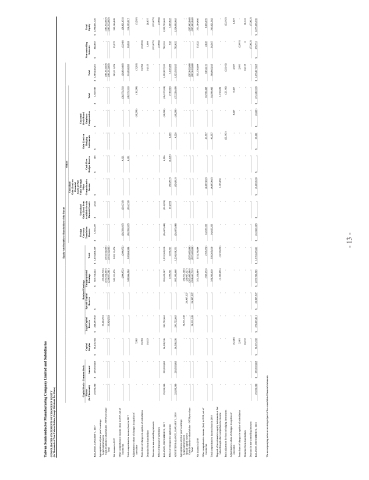
                                                                                                                                                                                                                                                                                                            Taiwan Semiconductor Manufacturing Company Limited and Subsidiaries
CONSOLIDATED STATEMENTS OF CHANGES IN EQUITY (In Thousands of New Taiwan Dollars, Except Dividends Per Share)
BALANCE, JANUARY 1, 2017 25,930,380 $ 259,303,805
$
56,272,304 $ 208,297,945 $ -
$
863,710,224
$
1,072,008,169
$
1,661,237
$
2,641
$
-
$
105
$
-
$
-
$
1,663,983
$ 1,389,248,261
$
802,865
$ 1,390,051,126
Appropriations of prior year’s earnings
- 33,424,718 - - - - - 33,424,718 -
(33,424,718 ) (181,512,663 ) (214,937,381 )
- (181,512,663 ) (181,512,663 )
- - -
- - -
- - -
- - -
- - -
- - -
- - -
- (181,512,663 ) (181,512,663 )
- - -
- (181,512,663 ) (181,512,663 )
Legal capital reserve - - Cash dividends to shareholders - NT$7 per share - - Total - -
Net income in 2017 - -
- - -
343,111,476
343,111,476
-
-
-
-
-
-
-
343,111,476
35,372
343,146,848
Other comprehensive income (loss) in 2017, net of
income tax - -
- - - - - -
(244,972 342,866,504
)
(244,972 ) 342,866,504
(28,358,917 (28,358,917
) )
(216,715 ) (216,715 )
- -
4,121 4,121
- -
- -
(28,571,511 (28,571,511
) )
(28,816,483 ) 314,294,993
(5,148 30,224
)
(28,821,631 ) 314,325,217
Total comprehensive income (loss) in 2017 - -
Adjustments to share of changes in equities of
associates - -
7,085 - - 10,994 - - 19,153 - -
- - - - -
- - - - -
- - - - -
- - - - -
- - - - - -
- - - - -
- - - - - -
(10,290 ) -
(10,290 ) -
(3,205 ) 10,994 19,153
- (10,994 ) 1,684 (113,675 ) (7,994 )
(3,205 ) -
From share of changes in equities of subsidiaries - - Donation from shareholders - - Decrease in non-controlling interests - - Effect of disposal of subsidiary - - BALANCE, DECEMBER 31, 2017 25,930,380 259,303,805 Effect of retrospective application - - ADJUSTED BALANCE, JANUARY 1, 2018 25,930,380 259,303,805 Appropriations of prior year’s earnings
- - -
- - -
- - -
-
20,837 (113,675 ) (7,994 )
Legal capital reserve - - Special capital reserve - - Cash dividends to shareholders - NT$8 per share - -
- 34,311,148 - - - 26,907,527 - - - - 34,311,148 26,907,527
(34,311,148 )
-
- - - -
- - - -
- - - -
- - - -
- - - -
- - - -
- - - -
-
- - - -
-
Total - -
(26,907,527 ) (207,443,044 ) (268,661,719 )
- (207,443,044 ) (207,443,044 )
- (207,443,044 ) (207,443,044 )
- (207,443,044 ) (207,443,044 )
Net income in 2018 - -
- - -
351,130,884
351,130,884
-
-
-
-
-
-
-
351,130,884
53,522
351,184,406
Other comprehensive income (loss) in 2018, net of
income tax - -
- - - - - -
(765,274 ) 350,365,610
(765,274 ) 350,365,610
14,655,333 14,655,333
- -
(4,097,465 ) (4,097,465 )
- -
41,537 41,537
- -
10,599,405 10,599,405
9,834,131 360,965,015
2,845 56,367
9,836,976 361,021,382
Total comprehensive income (loss) in 2018 - -
Disposal of investments in equity instruments at fair
value through other comprehensive income - -
- - - - - -
(1,193,056 ) -
(1,193,056 ) -
- -
- -
1,193,056 -
- -
- (22,162 )
- -
1,193,056 (22,162 )
- (22,162 )
- -
- (22,162 )
Basis adjustment for loss on hedging instruments - -
Adjustments to share of changes in equities of
associates - -
(6,420 ) - - 2,681 - - 10,135 - - - - - 56,315,932 $ 276,033,811 $ 26,907,527
- - - -
- - - -
- - - -
- - - - -
- - - -
- - - - -
- - - -
8,447 - - -
8,447 - - -
2,027
- (2,681 ) 6 (77,413 )
2,027 - 10,141
From share of changes in equities of subsidiaries - - Donation from shareholders - - Decrease in non-controlling interests - - BALANCE, DECEMBER 31, 2018 25,930,380 $ 259,303,805
$
$ 1,073,706,503
$ 1,376,647,841
$
(12,042,347 )
$
$
(3,429,324 )
$
$
23,601
$
(1,843 )$
(15,449,913 )
2,681 10,135 - $ 1,676,817,665
$
678,731
(77,413 ) $ 1,677,496,396
The accompanying notes are an integral part of the consolidated
financial statements.
Capital Stock - Common Stock Shares
Retained Earnings
Foreign Currency Translation Reserve
Unrealized Gain (Loss) from Available-for-sale Financial Assets
Unrealized Gain (Loss) on Financial Assets at Fair Value Through Other Comprehensive Income
Cash Flow Hedges Reserve
Gain (Loss) on Hedging Instruments
Unearned Stock-Based Employee Compensation
Non-controlling Interests
Total Equity
(In Thousands) Amount
Special Capital
Total
Total
Total
Capital Legal Capital
Surplus Reserve Reserve
Unappropriated Earnings
- - - 56,309,536 241,722,663 - - - - 56,309,536 241,722,663 -
991,639,347 1,556,321 993,195,668
1,233,362,010 1,556,321 1,234,918,331
(26,697,680 ) -
(214,074 ) 214,074 -
(524,915 (524,915 )
4,226 (4,226 -
)
4,226 4,226
(10,290 ) -
(26,917,818 ) (310,841 ) (27,228,659 )
- 1,522,057,533 1,245,480 1,523,303,013
702,110 342 702,452
1,522,759,643 1,245,822 1,524,005,465
Equity Attributable to Shareholders of the Parent
Others
- 13 -
(26,697,680 )
(10,290 )
)
