
Page 140 - TSMC 2018 Annual Report
P. 140
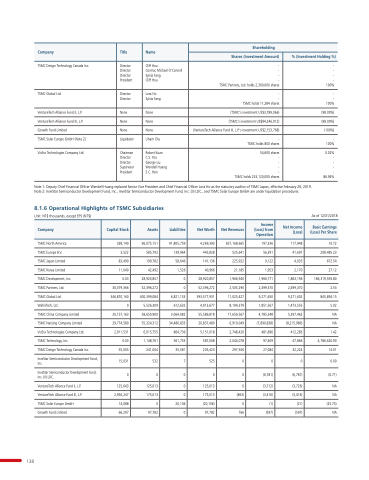
Company
Title
Name
Shareholding
Shares (Investment Amount)
% % (Investment Holding %)
Director Director Director President
Cliff Hou
Cormac Michael O’Connell Sylvia Fang
Cliff Hou
- - - - TSMC Partners Ltd holds 2 300 000 shares
Director Director Lora Ho Sylvia Fang
- - TSMC holds 11 284 shares
None
None
(TSMC’s investment US$3 789 066)
None
None
(TSMC’s investment US$94 246 012)
None
None
(VentureTech Alliance Fund III L P ’s investment US$2 153 768)
Liquidator
Liham Chu
- TSMC holds 800 shares
Chairman Director Director Supervisor President
Robert Kuan C S Yoo George Liu Wendell Huang S C Hsin
54 600 shares
- - - - TSMC holds 253 120 000 shares
TSMC Design Technology Canada Inc TSMC Global Ltd VentureTech Alliance Fund II L P VentureTech Alliance Fund III L P Growth Fund Limited
TSMC Solar Europe GmbH (Note 2)
VisEra Technologies Company
Ltd Note 1: Deputy Chief Chief Financial Financial Officer Officer Wendell Huang replaced Senior Vice President
and Chief Chief Financial Financial Officer Officer Lora Ho as the statutory auditor of TSMC Japan effective February 26 2019 Note 2: InveStar InveStar Semiconductor Semiconductor Development Development Fund Fund Inc Inc InveStar InveStar Semiconductor Semiconductor Development Development Fund Fund Inc Inc (II) LDC and TSMC Solar Europe GmbH are under liquidation procedures 8 1 6 Operational Highlights of TSMC Subsidiaries
Unit: NT$ NT$ thousands except EPS (NT$)
TSMC North America TSMC Europe B V TSMC Japan Limited
TSMC Korea Limited
TSMC Development Inc TSMC Partners Ltd TSMC Global Ltd WaferTech LLC
TSMC China Company
Limited
TSMC Nanjing Company
Limited
VisEra Technologies Company
Ltd TSMC Technology Inc TSMC Design Technology Canada Inc InveStar Semiconductor Development Fund Inc InveStar Semiconductor Development Fund Inc (II) LDC VentureTech Alliance Fund II L P VentureTech Alliance Fund III L P TSMC Solar Europe GmbH Growth Fund Limited
- - - 100%
- - 100%
(98 00%) (98 00%) (100%) - 100%
0 0 02% - - - 86 94%
As of 12/31/2018
10 72 208 485 23 672 54 27 12 186 319 593 80 2 53 845 894 15 5 02 NA NA 1 42 4 786 620 90 14 01 0 0 0 00 (0 71)
NA NA (25 73) NA Company
Capital Stock
Assets
58 650 900
Liabilities
Net Worth
Net Revenues
17 659 567
Income (Loss) from Operation Net Income (Loss) 5 397 462
Basic Earnings (Loss) Per Share 338 140
96 075 151
91 805 759
4 269 393
657 168 665
197 336
117 948
3 522
585 792
139 964
445 828
525 641
56 391
41
697
83 490
199 782
58 646
141 136
225 922
9 122
4 035
11 040
42 492
28 920 857
1 526
40
966
21 185
1 966
940
1 953
2 170
0 0 03 0 28 920 857
1 1 966
771
1 1 863 196
30 379 366
52 396 272
0 52 396 272
2 2 505 290
2 499 370
2 499 370
346 870 160
400 399 084
6 821 153 393
577 931
11 025 427
9 271 650 9 271 602
0 5 5 526
309
612 632
4 913 677
8 194 379 1 1 851 567
1 473 555
20 157 163
3 064 082
55 586 818
4 4 785 348
29 774 580
55 324 312
34 486 833
20 837 480
6 910 049
(7 890 838)
(8 215 989)
2 911 531
6 015 755
864 736
5 5 151
018 2 2 748 420
481 896
412 283
0 0 03 1 1 1 148 761
561 753
587 008
2 044 078
97 409
47 866
55 005
241 004
35
581
205 423
297 926
27 084
32
224
15 031
532
7 525 0 0 0 0 0 0 0 0 (6 781)
(6 781)
125 643
125 013
0 125 013
0 (3 712)
(3 726)
2 2 956 247
175 013
0 175 013
(863)
(3 416)
(3 416)
14 088
0 20 106
(20 106)
0 (1)
(21)
66 207
97 782
0 97 782
766
(597)
(597)
138
