
Page 337 - 2017 TSMC Annual Report
P. 337
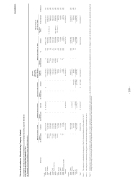
Taiwan Semiconductor Manufacturing Company Limited
STATEMENT OF CHANGES IN INVESTMENTS ACCOUNTED FOR USING EQUITY METHOD FOR THE YEAR ENDED DECEMBER 31, 2017
(In Thousands of New Taiwan Dollars, Unless Specified Otherwise)
Stocks TSMC
7 988,268 464,223 314 Tech 253,120
$ 265,634,729 51,749,910 8,806,384 7,163,516 5,234,883 4,340,303 2,599,807 1,174,181 353,695 132,999 35,706
2 $ 60,683,010
- -
- -
- -
- -
- -
- -
- -
- -
- -
- -
- -
- - - - - - - - - - - -
$
- $ (17,105,862) - (2,065,623) - (238,040) - (1,485,876) - (567,721) - (339,300) - (307,707) - 126,013 - 53,629 - (3,553) - 3,504 - (13,889) - (21,944,425)
9 988,268 464,223 314 253,120 11,000 111,282 46,688 - 6 80 1
100 $ 309,211,877 100 49,684,287 28 8,568,344 39 5,677,640 87 4,667,162 100 4,001,003 41 2,292,100 35 1,300,194 100 407,324 100 129,446 100 39,210
$ 309,211,877 Nil 49,813,953 Nil 30,638,751 Nil
TSMC VIS SSMC VisEra TSMC Xintec GUC TSMC TSMC TSMC TSMC
Global Partners
Note 1: Note 2: Note 3:
The unit price is calculated by closing price of Gre Tai Securities
The unit price is calculated by closing price of the Taiwan Stock Exchange as of December 29, 2017.
Solar Europe GmbH Subtotal
1
(6,328) 347,219,785
100 (20,217) 385,958,370
39,210 Nil (20,217) Nil
Capital
TSMC China TSMC Nanjing VTAF II VTAF III
- - - -
42,618,308 6,331,094 467,171 219,350 49,635,923
- -
- 21,724,892
- -
- 25,385
- - - -
- 8,442,577
- - - -
100 51,060,885 100 26,493,740 98 320,533 98 152,836 78,027,994
51,161,815 Nil 27,068,373 Nil 314,287 Nil 129,667 Nil
Subtotal Total
21,750,277 $ 82,433,287
(61,917) (29,982) (257,648) 6,899,442
78,674,142 $ 504,058,837
Investees
(In Thousands)
Amount
Shares
(In Thousands) Amount
(In Thousands)
Amount (Note 3)
Shares
(In Thousands)
%
Amount
(NT$)
Total Amount
Collateral
11,000 111,282 46,688 Europe - Japan 6 Korea 80
5,463,657 Nil 4,613,528 Nil 4,001,003 Nil 9,180,759 Nil
North America
Balance, January 1, 2017 Shares
Additions in Investment
Decrease in Investment Shares
Balance, December 31, 2017
Net Assets Value Unit Price
$ 396,855,708
Market as of December 29, 2017.
$
(257,648) $ (15,044,983)
$ 463,986,364
Including share of profit or loss of subsidiaries and associates, share of other comprehensive income
changes in percentage of ownership in subsidiaries and adjustments resulting from the transactions with subsidiaries and associates.
dividends received from subsidiaries and associates, adjustments to share of changes in equity of subsidiaries and associates, adjustments arising from
60,683,010
425,384,695
of subsidiaries and associates, cash
- 189 -
- 189 -
Increase (Decrease) in Using the Equity Method Amount
Market Value or
- (1,562,246) (195,731) 49,093
$
66 (Note 1)
82.5 (Note 1) 255 (Note 2)
11,905,404 Nil 407,324 Nil 129,446 Nil
STATEMENT 5
