
Page 281 - 2017 TSMC Annual Report
P. 281
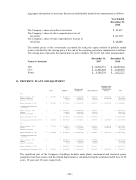
Aggregate information of associates that are not individually material was summarized as follows:
TheCompany’sshareofprofitsofassociates
The Company’s share of other comprehensive loss of
associates
The Company’s share of total comprehensive income of
associates
Year Ended December 31, 2016
$ 42,457 $ (17,777) $ 24,680
The market prices of the investments accounted for using the equity method in publicly traded stocks calculated by the closing price at the end of the reporting period are summarized as follows. The closing price represents the quoted price in active markets, the level 1 fair value measurement.
Name of Associate
VIS GUC Xintec
13. PROPERTY, PLANT AND EQUIPMENT
December 31, 2017
$ 30,638,751 $ 11,905,404 $ 9,180,759
December 31, 2016
$ 26,089,360 $ 3,664,997 $ 3,622,227
Cost
Balance at January 1, 2017 Additions (Deductions) Disposals or retirements
Balance at December 31, 2017
Accumulated depreciation and impairment
Balance at January 1, 2017 Additions
Disposals or retirements
Balance at December 31, 2017
Carrying amounts at December 31, 2017
Cost
Balance at January 1, 2016 Additions
Disposals or retirements
Balance at December 31, 2016
Accumulated depreciation and impairment
Balance at January 1, 2016 Additions
Disposals or retirements
Balance at December 31, 2016
Carrying amounts at December 31, 2016
Land
$ 3,212,000 - -
$ 3,212,000
$ - - -
$ - $ 3,212,000
$ 3,212,000 - -
$ 3,212,000
$ - - -
$ - $ 3,212,000
Buildings
$ 281,936,412 75,491,595
(36,957 ) $ 357,391,050
$ 156,854,513 19,798,087
(28,816 ) $ 176,623,784 $ 180,767,266
$ 272,949,721 9,000,012
(13,321 ) $ 281,936,412
$ 140,493,396 16,368,395
(7,278 ) $ 156,854,513 $ 125,081,899
Machinery and Equipment
$ 1,960,457,480 458,690,837
(49,921,595 ) $ 2,369,226,722
$ 1,504,061,808 226,251,816
(34,831,423 ) $ 1,695,482,201 $ 673,744,521
$ 1,807,955,631 155,226,807
(2,724,958 ) $ 1,960,457,480
$ 1,313,095,298 193,655,507
(2,688,997 ) $ 1,504,061,808 $ 456,395,672
Office Equipment
$ 31,830,657 7,888,336
(315,776 ) $ 39,403,217
$ 21,316,417 4,547,232
(315,737 ) $ 25,547,912 $ 13,855,305
$ 27,809,576 4,264,166
(243,085 ) $ 31,830,657
$ 17,606,080 3,953,422
(243,085 ) $ 21,316,417 $ 10,514,240
Equipment under Installation and Construction in
Progress Total
$ 384,197,526 $ 2,661,634,075 (239,420,648 ) 302,650,120
- (50,274,328 ) $ 144,776,878 $ 2,914,009,867
$ - $ 1,682,232,738 - 250,597,135
- (35,175,976 ) $ - $ 1,897,653,897 $ 144,776,878 $ 1,016,355,970
$ 191,052,758 $ 2,302,979,686 193,144,768 361,635,753
- (2,981,364 ) $ 384,197,526 $ 2,661,634,075
$ - $ 1,471,194,774 - 213,977,324
- (2,939,360 ) $ - $ 1,682,232,738 $ 384,197,526 $ 979,401,337
The significant part of the Company’s buildings includes main plants, mechanical and electrical power equipment and clean rooms, and the related depreciation is calculated using the estimated useful lives of 20 years, 10 years and 10 years, respectively.
- 133 -
- 133 -
