
Page 251 - 2017 TSMC Annual Report
P. 251
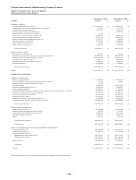
Taiwan Semiconductor Manufacturing Company Limited
PARENT COMPANY ONLY BALANCE SHEETS (In Thousands of New Taiwan Dollars)
ASSETS
CURRENT ASSETS
Cash and cash equivalents (Note 6)
Financial assets at fair value through profit or loss (Note 7) Available-for-sale financial assets
Held-to-maturity financial assets (Note 8)
Hedging derivative financial assets (Note 9)
Notes and accounts receivable, net (Note 10)
Receivables from related parties (Note 32)
Other receivables from related parties (Note 32) Inventories (Notes 5, 11 and 35)
Other financial assets (Note 35)
Other current assets (Note 15)
Total current assets
NONCURRENT ASSETS
Financial assets carried at cost
Investments accounted for using equity method (Notes 5 and 12) Property, plant and equipment (Notes 5 and 13)
Intangible assets (Notes 5 and 14)
Deferred income tax assets (Notes 5 and 27)
Refundable deposits
Total noncurrent assets TOTAL
LIABILITIES AND EQUITY
CURRENT LIABILITIES
Short-term loans (Note 16)
Financial liabilities at fair value through profit or loss (Note 7)
Hedging derivative financial liabilities (Note 9)
Accounts payable
Payables to related parties (Note 32)
Salary and bonus payable
Accrued profit sharing bonus to employees and compensation to directors (Notes 21 and 29) Payables to contractors and equipment suppliers
Income tax payable (Notes 5 and 27)
Provisions (Notes 5 and 17)
Long-term liabilities - current portion (Note 18)
Accrued expenses and other current liabilities (Note 20)
Total current liabilities
NONCURRENT LIABILITIES
Bonds payable (Note 18)
Deferred income tax liabilities (Notes 5 and 27) Net defined benefit liability (Notes 5 and 19) Guarantee deposits (Note 20)
Others
Total noncurrent liabilities
Total liabilities
EQUITY ATTRIBUTABLE TO SHAREHOLDERS OF THE PARENT Capital stock (Note 21)
Capital surplus (Note 21)
Retained earnings (Note 21)
Appropriated as legal capital reserve Unappropriated earnings
Others (Note 21) Total equity
TOTAL
The accompanying notes are an integral part of the parent company only financial statements.
- 103 -
December 31, 2017 Amount %
239,176,841 12 373,351 - 2,393,555 - - - 7,378 - 26,655,427 2 92,141,837 5 3,143,872 - 70,297,445 4 94,839 - 2,484,792 -
436,769,337 23
415,051 - 463,986,364 24 1,016,355,970 52 9,870,127 - 10,829,473 1 1,163,069 -
1,502,620,054 77 1,939,389,391 100
63,766,850 3 18,764 - 15,562 - 25,605,223 1 4,829,664 - 12,283,321 1 23,388,002 1 50,363,976 3 32,950,667 2 13,174,825 1 24,300,000 1 57,686,386 3
308,383,240 16
91,800,000 5 302,205 - 8,850,704 1 7,582,479 - 413,230 -
108,948,618 6 417,331,858 22
259,303,805 13 56,309,536 3
241,722,663 12
991,639,347 51 1,233,362,010 63
(26,917,818) (1) 1,522,057,533 78 1,939,389,391 100
December 31, 2016
- 103 -
$
$
Amount
249,878,563 151,070 2,843,952 11,447,538 - 40,017,297 86,845,570 948,800 46,504,346 2,139,366 3,004,662
443,781,164
435,268 396,855,708 979,401,337 10,047,991 6,446,781 369,895
1,393,556,980 1,837,338,144
57,958,200 62,441 - 24,533,924 4,840,001 11,570,505 22,794,771 62,449,143 40,256,148 16,991,612 38,100,000 28,620,469
308,177,214
116,100,000 141,183 8,551,408 14,666,542 453,536
139,912,669 448,089,883
259,303,805 56,272,304
208,297,945
863,710,224 1,072,008,169 1,663,983
1,389,248,261 1,837,338,144
%
14 - - 1 - 2 5 - 2 - -
24
- 22 53 1 - -
76 100
3 - - 1 - 1 1 4 2 1 2 2
17
6 - - 1 -
7 24
14 3
12 47 59
- 76 100
$
$
$
$
$
$
