
Page 25 - 2017 TSMC Annual Report
P. 25
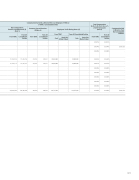
- 6 6 381 650 - - - - - - - - 6 6 381 650 Compensation Earned by a a a a a Director Who is an Employee of of TSMC TSMC or or of TSMC’s Consolidated Entities
Total
Compensation (A+B+C+D+E+F+G) as a a a a % of 2017 Net Income
(Note 6)
From All From From TSMC Consolidated Entities
Base Compensation Bonuses and Allowances (E) (Note 5)
From All From From TSMC Consolidated Entities
Severance Pay and Pensions (F)(Note 4)
From All From From TSMC Consolidated Entities
Employees’ Pro t Sharing Bonus (G)
From From TSMC From From All Consolidated Entities
Compensation Paid to to Directors from Non-consolidated Af liates
Cash
Stock (Fair Market Value)
Cash
Stock (Fair Market Value)
- - - - - - - - 0 0 0 0901%
0 0 0 0901%
- - - - - - - - 0 0 0 0074%
0 0 0 0074%
- - - - - - - - 0 0 0 0028%
0 0 0 0028%
111 393 154
111 393 154
215 251
215 251
99 883 980
- 99 883 980
- 0 0 0616%
0 0 0616%
111 547 115
111 547 115
215 251
215 251
99 883 980
- 99 883 980
- 0 0 0617%
0 0 0617%
- - - - - - - - 0 0 0 0043%
0 0 0 0043%
- - - - - - - - 0 0 0 0035%
0 0 0 0035%
- - - - - - - - 0 0 0 0043%
0 0 0 0043%
- - - - - - - - 0 0 0 0035%
0 0 0 0035%
- - - - - - - - 0 0 0 0043%
0 0 0 0043%
0 222 940 269
222 940 269
430 502
430 502
199 767 960
- 199 767 960
- 0 2435%
0 2435%
023
