
Page 235 - 2017 TSMC Annual Report
P. 235
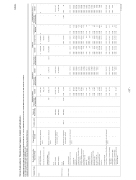
Taiwan Semiconductor Manufacturing Company Limited and Subsidiaries
MARKETABLE SECURITIES ACQUIRED AND DISPOSED OF AT COSTS OR PRICES OF AT LEAST NT$300 MILLION OR 20% OF THE PAID-IN CAPITAL FOR THE YEAR ENDED DECEMBER 31, 2017
(Amounts in Thousands of New Taiwan Dollars, Unless Specified Otherwise)
Company Name
Counter-party
Shares/Units (In Thousands)
Amount Shares/Units (In Thousands)
Amount Shares/Units (In Thousands)
Gain/Loss on Shares/Units Disposal (In Thousands)
Amount
TSMC
Corporate bond
CPC Corporation, Taiwan
TSMC Partners
Stock ISDF II
TSMC Global
Corporate bond
Bank of America Corp
Marketable Securities Type and Name
Financial Statement Account
Nature of Relationship
Beginning Balance
Acquisition
Disposal
Amount Carrying Value
Ending Balance (Note 1)
Hon Hai Precision Ind. Co., Ltd.
"
Commercial paper Taiwan Power Company
Held-to-maturity financial assets
-
- 865
8,628,176 170
1,695,771 1,035
10,350,000 10,350,000
- -
-
Stock
TSMC Global
Investments accounted for using equity method
- -
Subsidiary 7 Subsidiary -
265,634,729 2 6,331,094 -
60,683,010 - 21,724,892 -
- - - -
- 9
- -
309,211,877 26,493,740
TSMC Nanjing
"
Citigroup Inc
AT&T Inc
JPMorgan Chase & Co Goldman Sachs Group Inc/The Morgan Stanley
" " " " " " " " " " " " " " " " " "
- - - - - - - - - - - - - - - - - -
- - - - - - - - - - - - - - - - - - - - - - - - - - - - - - - - - - - -
US$ 16,819 - US$ 13,332 - US$ 22,330 - US$ 7,390 - US$ 11,237 - US$ 17,059 - US$ 7,877 -
US$ 18,955 - US$ 19,933 - US$ 16,030 - US$ 17,211 - US$ 16,115 - US$ 16,250 - US$ 11,849 - US$ 17,144 - US$ 14,737 - US$ 12,683 - US$ 10,762 - US$ 11,600 - US$ 11,078 - US$ 11,279 - US$ 10,425 - US$ 5,995 -
US$ 5,816 US$ 5,833 US$ US$ 6,425 US$ 6,438 US$ US$ 12,151 US$ 12,258 US$ US$ 1,900 US$ 1,976 US$ US$ 9,018 US$ 8,973 US$ US$ 15,042 US$ 15,163 US$ US$ 1,964 US$ 2,016 US$
(17) -
US$ US$ US$ US$ US$ US$ US$ US$ US$ US$ US$ US$ US$ US$ US$ US$ US$ US$
29,911 26,867 26,159 22,709 18,505 18,298 17,732 17,024 16,463 12,722 12,214 11,613 11,073
Verizon Communications Inc Ford Motor Credit Co LLC BAT Capital Corp
Apple Inc
- - US$ 2,607 - - - US$ 1,704 - - - US$ 1,994 - US$ 2,905 - - - US$ 7,180 - US$ 11,850 - US$ 11,618 -
- -
US$ 854 US$ 862 US$
(13) - (107) - (76) - 45 - (121) - (52) - - - (8) - - - 1 - - - (1) - 84 - 13 - 57 - (266) - 86 -
Morgan Stanley
Tyson Foods Inc JPMorgan Chase & Co Asian Development Bank Microsoft Corp QUALCOMM Inc
BMW US Capital LLC Gilead Sciences Inc Aetna Inc
- US$ -
US$ 201 US$ 200 US$
Government bond
United States Treasury Note/Bond
Available-for-sale financial assets
- -
- - - -
US$ 195,285 - US$ 30,756 - - -
US$ 396,552 - US$ 182,629 -
US$ 393,853 US$ 394,514 US$ US$ 163,600 US$ 163,487 US$
(661) -
US$ US$ US$
202,689 49,901 2,997
United States Treasury Floating Rate Note
"
113 -
United States Treasury Bill United States Treasury Bill United States Treasury Inflation
" " "
- - -
- - - - - -
US$ 28,180 - US$ 97,678 - US$ 8,060 -
US$ 25,197 US$ 25,187 US$ US$ 97,712 US$ 97,678 US$ US$ 27,343 US$ 27,515 US$
10 -
Indexed Bonds
Held-to-maturity financial assets
- -
-- --
$ 1,967,303 - 400,250 -
$- - - -
$ 1,960,000 $ 1,960,000 $ 400,000 400,000
- -
- -
$- -
Investments accounted for using equity method
Note 2
Subsidiary 9,299
US$ 6,078 -
- -
- US$ 15,552
- 9,299
US$
28
Available-for-sale financial assets
-
- -
US$ 27,973 -
US$ 30,914 -
US$ 18,071 US$ 18,205 US$
(134) -
US$
40,876
- - US$ 19,349 -
34 - (172) -
- -
- 87 -
- 87 -
- -
- -
- -
US$ 1,997 US$ 1,998 US$ US$ 5,076 US$ 4,992 US$ US$ 3,561 US$ 3,548 US$ US$ 10,552 US$ 10,495 US$ US$ 10,340 US$ 10,606 US$ US$ 10,656 US$ 10,570 US$
9,301 6,866 2,719 1,608 1,099
TABLE 4
(Continued)
