
Page 226 - 2017 TSMC Annual Report
P. 226
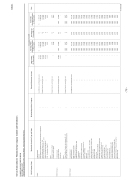
Taiwan Semiconductor Manufacturing Company Limited and Subsidiaries
MARKETABLE SECURITIES HELD
DECEMBER 31, 2017
(Amounts in Thousands of New Taiwan Dollars, Unless Specified Otherwise)
TSMC
Common stock
Motech
Semiconductor Manufacturing International Corporation United Industrial Gases Co., Ltd.
Shin-Etsu Handotai Taiwan Co., Ltd.
Global Investment Holding Inc.
W.K. Technology Fund IV
Held Company Name
Marketable Securities Type and Name
Relationship with the Company
Financial Statement Account
Shares/Units (In Thousands)
Carrying Value (Foreign Currencies in Thousands)
Percentage of Ownership (%)
Fair Value Note (Foreign Currencies
TSMC Partners
Common stock Tela Innovations Mcube Inc.
TSMC Global
Corporate bond
Morgan Stanley
Bank of America Corp - JPMorgan Chase & Co - Goldman Sachs Group Inc/The - Citigroup Inc - AT&T Inc - Ford Motor Credit Co LLC - Verizon Communications Inc - BAT Capital Corp - Apple Inc - PNC Bank NA - Credit Suisse AG/New York NY - Anheuser-Busch InBev Finance Inc - Tyson Foods Inc - Southern Co/The - AbbVie Inc - Asian Development Bank - Mitsubishi UFJ Financial Group Inc - Capital One NA/Mclean VA - Westpac Banking Corp - Cardinal Health Inc - BP Capital Markets PLC - CVS Health Corp - Wells Fargo & Co - Svenska Handelsbanken AB - Aviation Capital Group Corp - American International Group Inc - Sumitomo Mitsui Financial Group Inc - Microsoft Corp -
Fund
Horizon Ventures Fund Crimson Asia Capital
- -
Financial assets carried at cost "
- -
6,975 6,410
12 1
6,975 6,410
Fund
China Walden Venture Investments II, L.P. Shanghai Walden Venture Capital Enterprise
- -
Financial assets carried at cost "
- -
US$ 8,607 US$ 4,270
9 6
US$ 8,607 US$ 4,270
- - - - - -
Available-for-sale financial assets "
58,320 21,105 21,230 10,500 11,124
$ 1,309,279 1,084,276 193,584 105,000 99,041 4,041
12 - 10 7 6 2
$ 1,309,279 1,084,276 193,584 105,000 99,041 4,041
- -
10,440 " 6,333
-
Available-for-sale financial assets "
- - - - - - - - - - - - - - - - - - - - - - - - - - - - -
US$ 43,115 US$ 42,703 US$ 40,101 US$ 38,465 US$ 29,911 US$ 26,867 US$ 18,533 US$ 18,298 US$ 17,024 US$ 16,463 US$ 14,412 US$ 13,623 US$ 13,406 US$ 12,214 US$ 12,015 US$ 11,097 US$ 11,073 US$ 10,791 US$ 10,465 US$ 10,464 US$ 10,383 US$ 10,264 US$ 10,018 US$ 9,868 US$ 9,862 US$ 9,620 US$ 9,410 US$ 9,396 US$ 9,301
N/A N/A N/A N/A N/A N/A N/A N/A N/A N/A N/A N/A N/A N/A N/A N/A N/A N/A N/A N/A N/A N/A N/A N/A N/A N/A N/A N/A N/A
US$ 43,115 US$ 42,703 US$ 40,101 US$ 38,465 US$ 29,911 US$ 26,867 US$ 18,533 US$ 18,298 US$ 17,024 US$ 16,463 US$ 14,412 US$ 13,623 US$ 13,406 US$ 12,214 US$ 12,015 US$ 11,097 US$ 11,073 US$ 10,791 US$ 10,465 US$ 10,464 US$ 10,383 US$ 10,264 US$ 10,018 US$ 9,868 US$ 9,862 US$ 9,620 US$ 9,410 US$ 9,396 US$ 9,301
Financial assets carried at cost "
Financial assets carried at cost
US$ 65,000 -
25 12
US$ 65,000 -
- 78 -
- 78 -
" "
1,152
" " " " " " " " " " " " " " " " " " " " " " " " " " "
December 31, 2017
in Thousands)
TABLE 3
(Continued)
