
Page 209 - 2017 TSMC Annual Report
P. 209
TSMC’s profit sharing bonus to employees and compensation to directors in the amounts of NT$23,019,082 thousand and NT$368,919 thousand in cash for 2017, respectively, and profit sharing bonus to employees and compensation to directors in the amounts of NT$22,418,339 thousand and NT$376,432 thousand in cash for 2016, respectively, had been approved by the Board of Directors of TSMC held on February 13, 2018 and February 14, 2017, respectively. There is no significant difference between the aforementioned approved amounts and the amounts charged against earnings of 2017 and 2016, respectively.
TSMC’s profit sharing bonus to employees and compensation to directors in the amounts of NT$20,556,888 thousand and NT$356,186 thousand in cash for 2015, respectively, had been approved by the Board of Directors on February 2, 2016. The profit sharing bonus to employees and compensation to directors in cash for 2015 had been reported to TSMC’s shareholders in its meeting held on June 7, 2016, after the amended TSMC’s Articles of Incorporation had been approved. The aforementioned approved amount has no difference with the one recognized in the consolidated financial statements for the year ended December 31, 2015.
The information about the appropriations of TSMC’s profit sharing bonus to employees and compensation
to directors is available at the Market Observation Post System website.
32. CAPITALMANAGEMENT
The Company requires significant amounts of capital to build and expand its production facilities and acquire additional equipment. In consideration of the industry dynamics, the Company manages its capital in a manner to ensure that it has sufficient and necessary financial resources to fund its working capital needs, capital asset purchases, research and development activities, dividend payments, debt service requirements and other business requirements associated with its existing operations over the next 12 months.
33. FINANCIALINSTRUMENTS
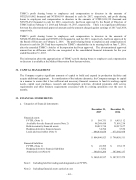
a. Categories of financial instruments
Financial assets
FVTPL (Note 1)
Available-for-sale financial assets (Note 2) Held-to-maturity financial assets
Hedging derivative financial assets
Loans and receivables (Note 3)
Financial liabilities
FVTPL (Note 1)
Hedging derivative financial liabilities Amortized cost (Note 4)
Note 1: Including held for trading and designated as at FVTPL. Note 2: Including financial assets carried at cost.
December 31, 2017
$ 569,751 98,248,410 20,821,714 34,394 684,416,654
$ 804,090,923
$ 26,709 15,562 340,501,266
$ 340,543,537
December 31, 2016
$
$ $
$
6,451,112 71,891,234 38,917,677
5,550 673,592,938
790,858,511
191,135 - 387,046,137
387,237,272
- 61 -
- 61 -
