
Page 205 - 2017 TSMC Annual Report
P. 205
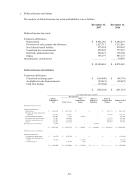
c. Deferred income tax balance
The analysis of deferred income tax assets and liabilities was as follows:
December 31, 2017
Deferred income tax assets
Temporary differences
Depreciation
Provision for sales returns and allowance
Net defined benefit liability
Unrealized loss on inventories
Deferred compensation cost
Others 195,197
December 31, 2016
Operating loss carryforward
Deferred income tax liabilities
Temporary differences
Unrealized exchange gains Available-for-sale financial assets Cash flow hedges
- $ 12,105,463
$ 8,401,266 1,637,713 975,324 629,442 266,521
$
$
$
$
4,244,214 1,512,061 939,543 737,247 378,740 445,133 14,483
8,271,421
(48,736) (92,447)
- (141,183)
Balance, End of Year
Year Ended December 31, 2017 Recognized in
$
$
(169,480) (95,421) (37,304)
(302,205)
Balance, Beginning of Year
$ 4,244,214
allowance
Net defined benefit liability
Unrealized loss on inventories
Deferred compensation cost
Others 445,133
Other Comprehensive
Profit or Loss Income
Effect of Disposal of Subsidiary
- - - - -
(14,483 ) (14,483 )
-
- -
Effect of Exchange Rate Changes
Deferred income tax assets
Temporary differences Depreciation
Provision for sales returns and
$
$
$
4,207,209 $-
129,971 - 5,219 30,562 (105,068 ) - (83,124 ) - (222,429 ) - - -
3,931,778 $ 30,562
(120,744 ) $-
$
$
$
-
$
$
$
(50,157 )
(4,319 ) -
(2,737 ) (29,095 ) (27,507 )
- (113,815 )
-
- -
$
8,401,266
1,637,713 975,324 629,442 266,521 195,197
Operating loss carryforward
Deferred income tax liabilities
Temporary differences Unrealized exchange gains Available-for-sale financial
assets
Cash flow hedges
14,483 $ 8,271,421
$ (48,736
(92,447 -
)
- $ 12,105,463
$ (169,480 )
(95,421 ) (37,304)
1,512,061 939,543 737,247 378,740
)- (2,974 ) (36,742 ) (562)
$ (141,183 ) $ (157,486 )
$ (3,536) $ - $ - $ (302,205)
- 57 -
- 57 -
